Color only the difference between Actual and reference, rather than filling the whole chart with variance status.
Basic and difference layouts
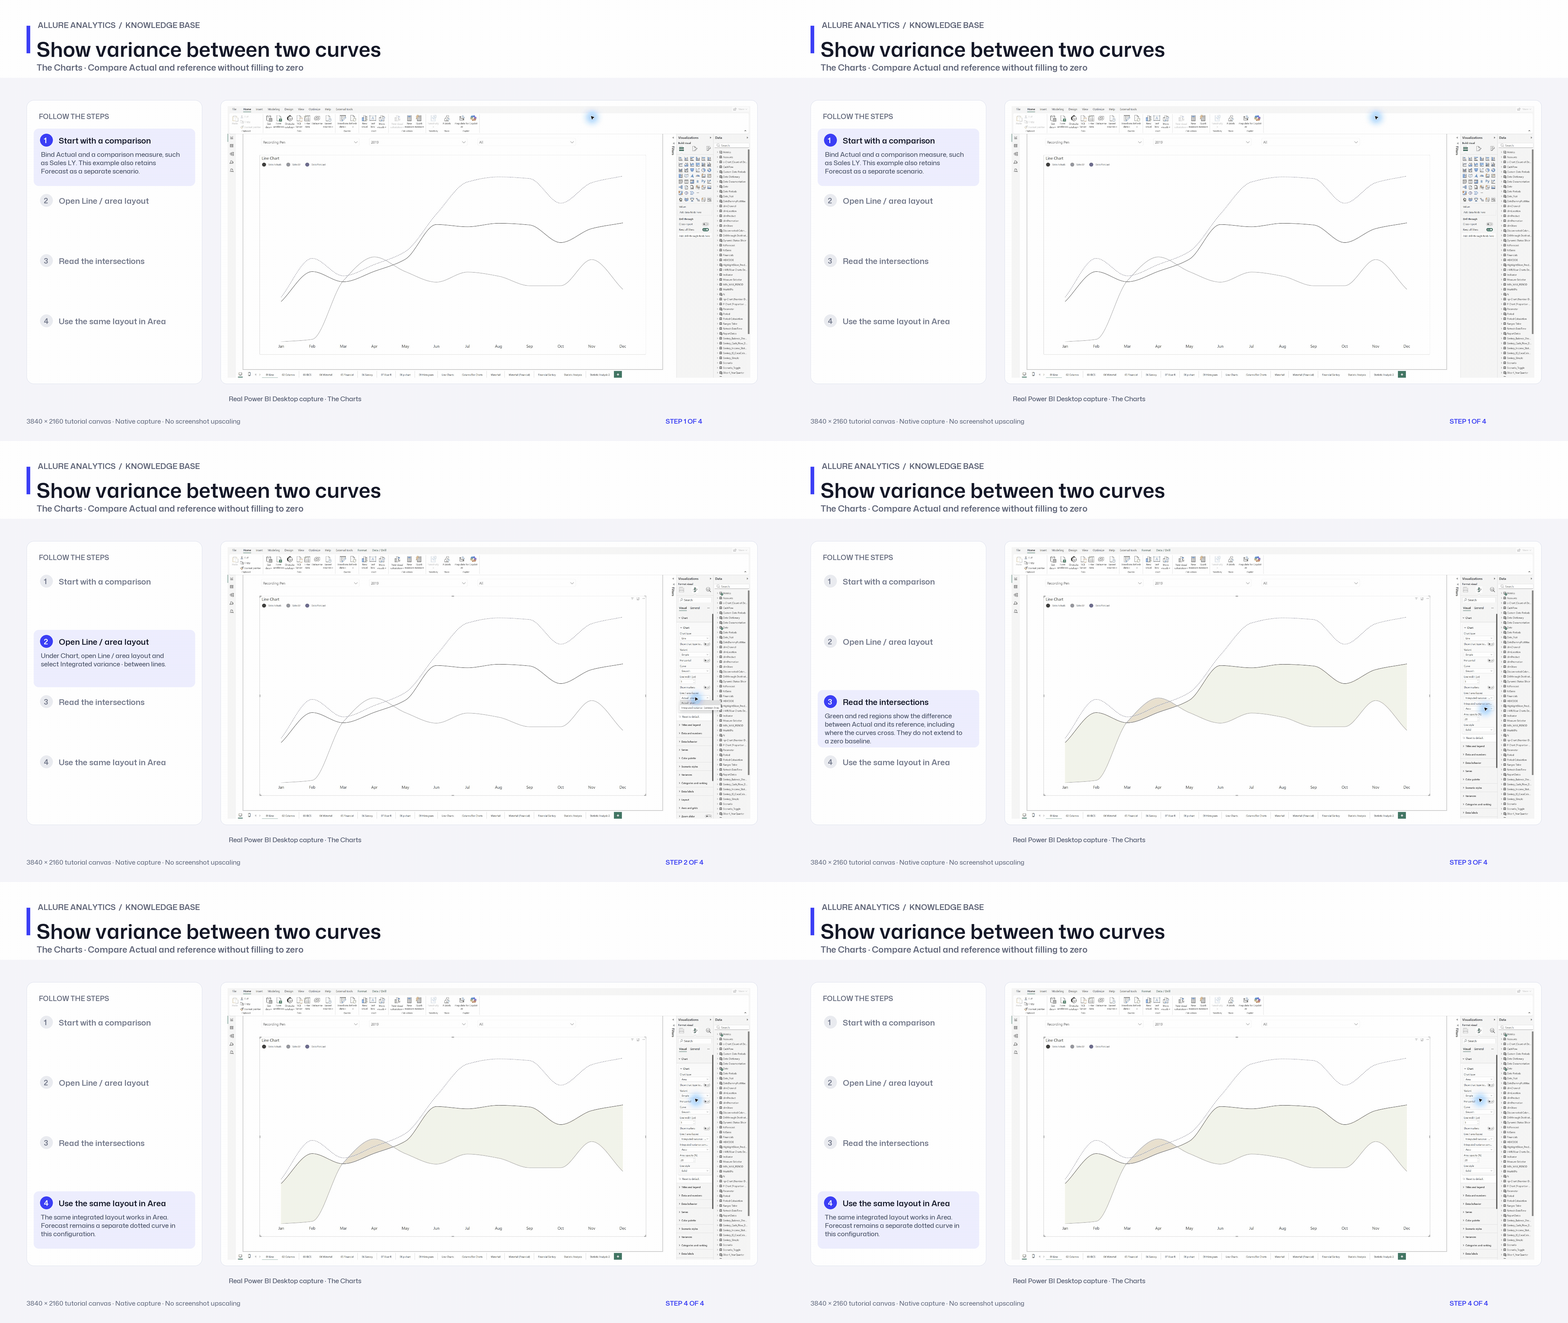
Choose Line or Area. Chart → Line / area layout offers Actual · plain and Integrated variance · between lines. Select the comparison scenario. Positive/negative colored regions follow the difference between the finite curves, including intersections; they do not extend to the zero baseline.
Integrated variance areas follow the differences where Actual and reference cross.
Click to enlarge.
Curves, area and circles
- Straight, Smooth and Stepped curves are available.
- Area line width can be 0, leaving only the area fill. Per-series outlines can also be zero.
- Show markers independently; choose Filled or Hollow circle with fill/outline controls.
- Circle, Line and circle, and Halo Circle hover options include fixed-pixel size and appearance controls.
- Missing comparison segments remain gaps rather than joining unrelated finite points.
Range, dates and labels
Line/non-stacked Area Auto range fits data points by default. Turn Start from zero On to include zero. Categorical model dates can scroll; Continuous uses model-date spacing. Use Data labels → Fit full labels on resize and Text wrap, and corresponding category-label controls in Axes and grids.
Reference recipes
Line and Area reference recipes
Show variance between two curves
Native integrated Line/Area variance chapter. Marker, date-axis and label recipes remain in their dedicated documentation.
3840 × 2160 tutorial canvas at 20 fps. Real 2560 × 1392 Power BI Desktop screenshots retain their native size; this is a paced step sequence.
- Start with a comparison — Bind Actual and a comparison measure, such as Sales LY. This example also retains Forecast as a separate scenario.
- Open Line / area layout — Under Chart, open Line / area layout and select Integrated variance · between lines.
- Read the intersections — Green and red regions show the difference between Actual and its reference, including where the curves cross. They do not extend to a zero baseline.
- Use the same layout in Area — The same integrated layout works in Area. Forecast remains a separate dotted curve in this configuration.