Add PY, PL, Budget or FC once and keep absolute/relative comparisons when groups are added.
Automatic and configured comparisons
Chart and Table automatically include absolute and relative variances for bound comparison scenarios. Adding Month to Columns / groups repeats them in every group rather than removing them. New bound scenarios are added while explicit hidden columns or disabled comparisons remain respected.
- Bind Actual and the comparison measures.
- Open Compare to choose base, reference, direction and absolute/relative/both/none output.
- For Chart, choose variance bar, pin or another applicable chart in Specific column.
- Format units, interpretation, zero line and limits; check representative positive and negative rows.
Make variance bars readable
Variance charts controls full-row-height bars, vertical padding, zero-line color/width, centered zero and labels beside bar ends or at the column edge. Absolute and percentage variances have independent scales. Automatic scaling uses the loaded visible rows.
Actual/Prior values with separate absolute bars and relative pins.
Click to enlarge.
Cap a large outlier
Set Absolute variance limit in raw measure units or Relative variance limit (%). Zero means Automatic. Clipped marks can show an overflow arrow, while their label and tooltip keep the original amount. Level is the default variance scaling scope.
Missing reference
Blank operands or a zero denominator give blank relative variance. The visual does not manufacture prior-year values.
Percentage rows are independently scoped
Rows such as Gross Margin % can show pp or bp/bps for their automatic variance without changing amount rows or their source percentages. Custom column formulas also support an explicit percentage-variance result flag. Percentage comparisons: pp, bp and bps
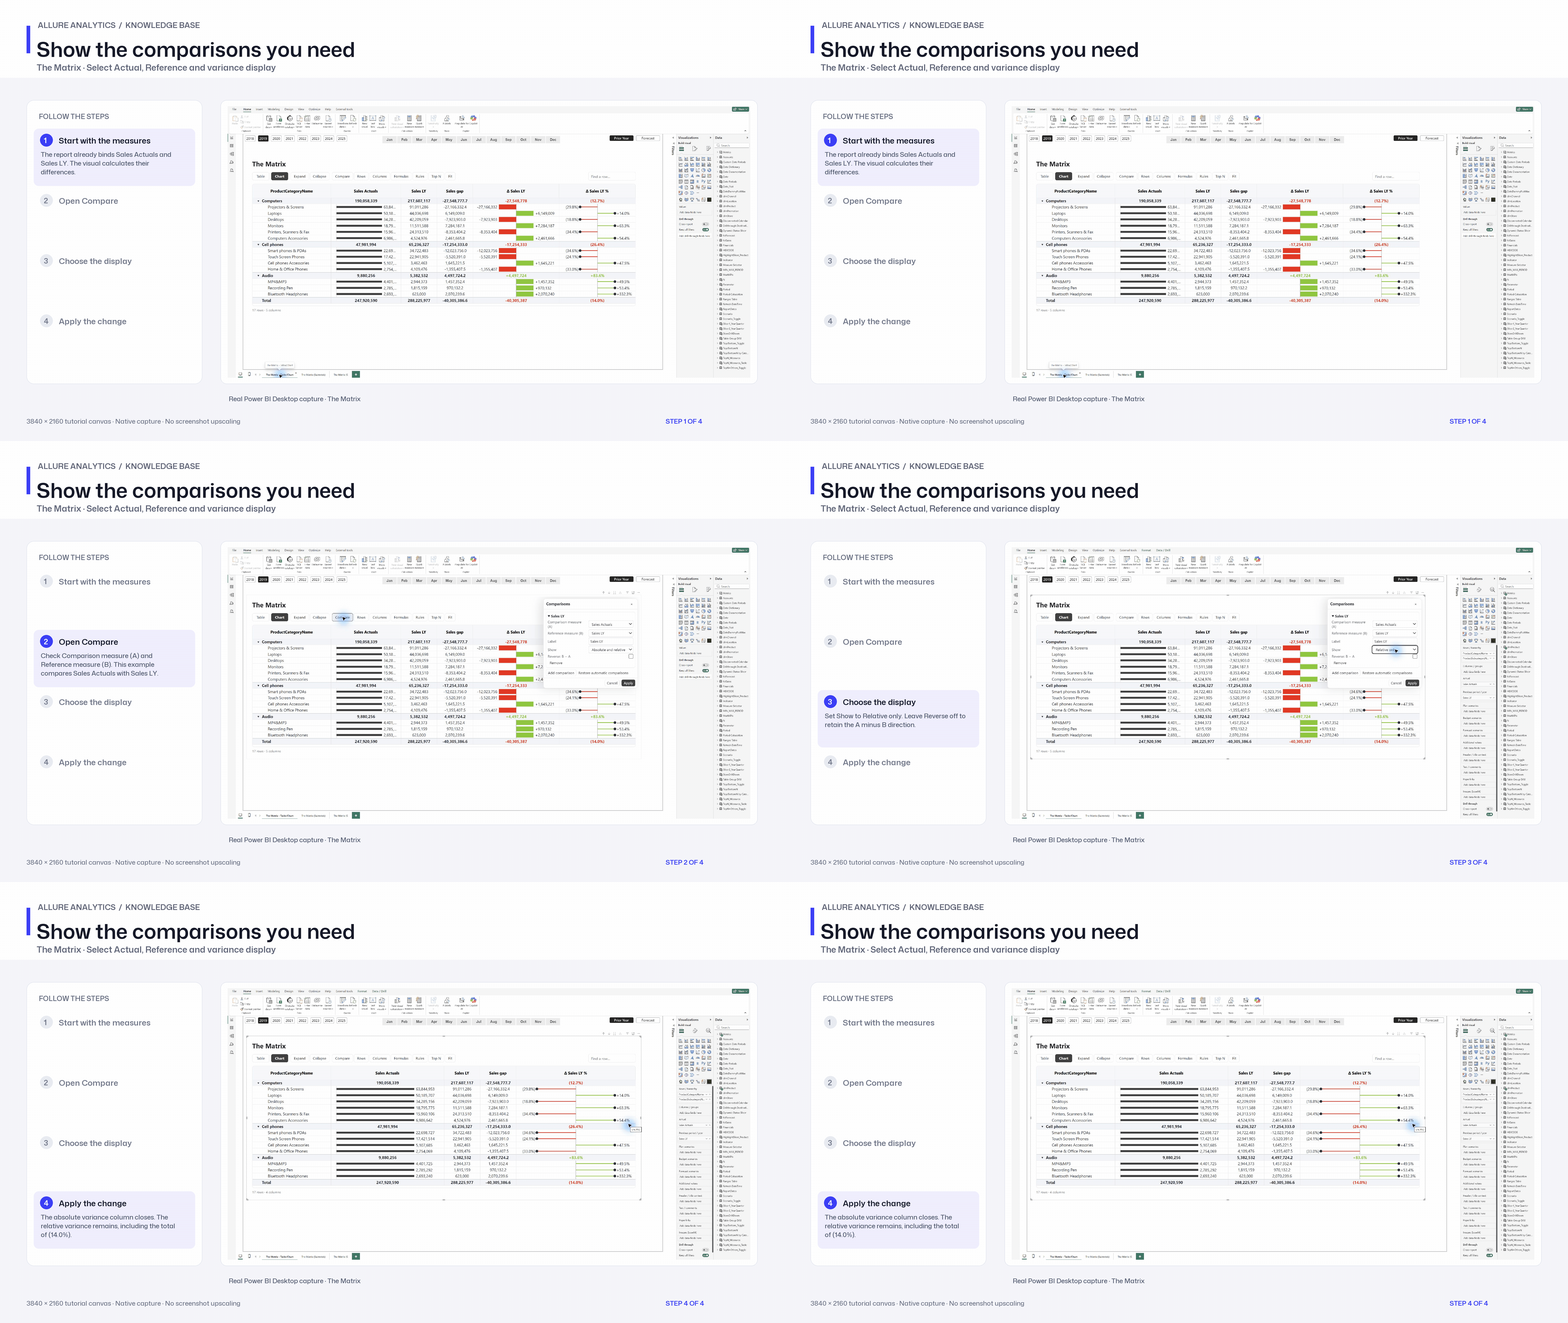
Show the comparisons you need
Native comparison editor: absolute and relative versus relative-only display.
3840 × 2160 tutorial canvas at 20 fps. Real 2560 × 1392 Power BI Desktop screenshots retain their native size; this is a paced step sequence.
- Start with the measures — The report already binds Sales Actuals and Sales LY. The visual calculates their differences.
- Open Compare — Check Comparison measure (A) and Reference measure (B). This example compares Sales Actuals with Sales LY.
- Choose the display — Set Show to Relative only. Leave Reverse off to retain the A minus B direction.
- Apply the change — The absolute variance column closes. The relative variance remains, including the total of (14.0%).