Reduce expensive model combinations before shrinking the visual.
Data volume is determined by the model
One daily Date dimension may contain about 3,000 rows, but combining fields from other tables can greatly expand the joined query. One hundred supported slicer fields is a capacity limit, not a promise of a small query. The visual can only use supplied fields, relationships and permitted data.
- Prefer explicit measures and meaningful granularity.
- Use Observation ID only when individual raw samples are needed.
- Limit unnecessary cross-table slicer combinations.
- Use small multiples and grouping intentionally; many panels still require data and rendering.
- Preserve non-additive totals in model measures.
Paging and loading
Filter Box queries fields in 10,000-row windows and selection-based periods wait for full Date data. The Matrix offers Load more; its visual formulas, Top N and scales use loaded rows. Statistical Analysis waits for complete loaded data before analysis. Host query/memory/RLS restrictions still apply.
Responsive priorities
Use columns/rows, pinned Matrix priorities, card layouts and scrolling to keep required values reachable. Responsiveness is a presentation strategy, not a substitute for missing data. Avoid summing partial data and interpreting it as a complete model total.
Keep data and layout manageable
Native configuration examples for granularity and responsive presentation. This is a design workflow, not a measured performance benchmark.
3840 × 2160 tutorial canvas at 20 fps. Real 2560 × 1392 Power BI Desktop screenshots retain their native size; this is a paced step sequence.
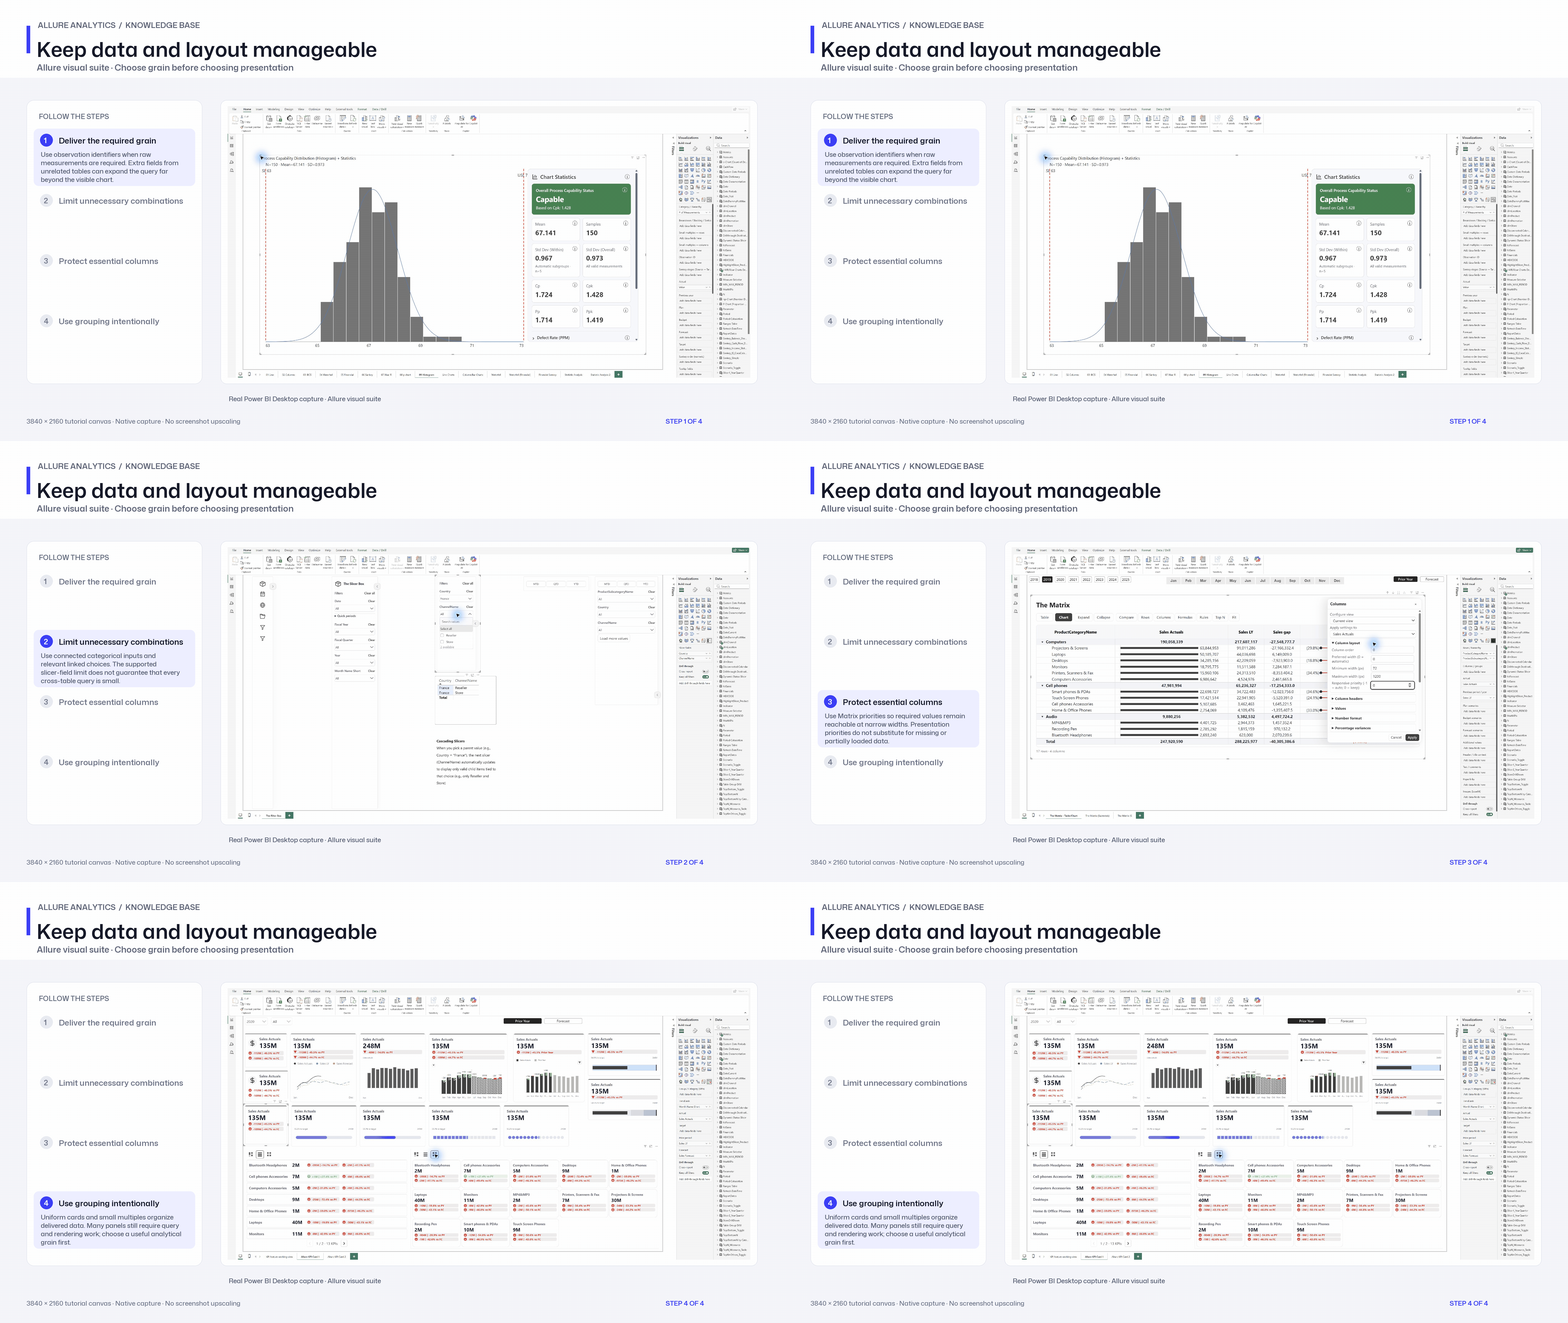
- Deliver the required grain — Use observation identifiers when raw measurements are required. Extra fields from unrelated tables can expand the query far beyond the visible chart.
- Limit unnecessary combinations — Use connected categorical inputs and relevant linked choices. The supported slicer-field limit does not guarantee that every cross-table query is small.
- Protect essential columns — Use Matrix priorities so required values remain reachable at narrow widths. Presentation priorities do not substitute for missing or partially loaded data.
- Use grouping intentionally — Uniform cards and small multiples organize delivered data. Many panels still require query and rendering work; choose a useful analytical grain first.