A better way into your data.
Make filtering a clear part of the reporting experience, so the right view is always within reach.
Regional performance, segment analysis and guided report navigation.
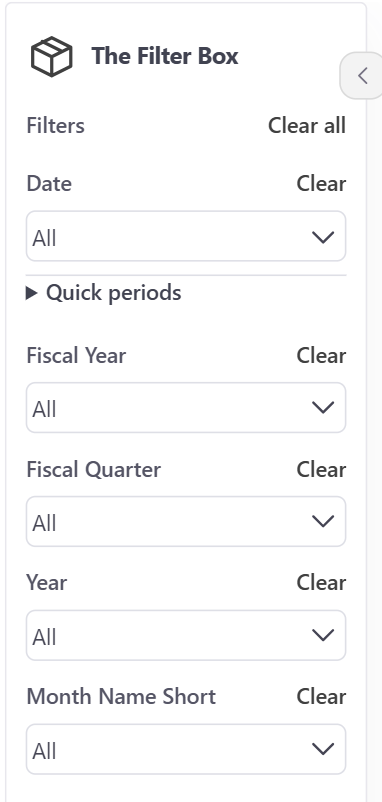
Date, fiscal year, quarter, year and month filters
See the relevant feature demonstration below and review the Knowledge Base for setup and usage guidance.
01
Quick period selections
See the relevant feature demonstration below and review the Knowledge Base for setup and usage guidance.
02
Individual and global clear controls
See the relevant feature demonstration below and review the Knowledge Base for setup and usage guidance.
01
Built for clearer reporting
Regional performance, segment analysis and guided report navigation.
Explore the screenshots and individual demonstrations below. Product compatibility, deployment and licensing are confirmed for your requirements.
- Date, fiscal year, quarter, year and month filters
- Quick period selections
- Individual and global clear controls
- A compact, collapsible filter container
PRODUCT LICENSING & SUPPORT
Let’s find the right fit.
Add your slicers
- Start with one slicer
- One field creates a filter with native report behavior.
- Add the fields you need
- Year, month and country stay together in one visual.
Time intelligence
- MTD → one click, actual filtering
- The selection sets the endpoint. The neighboring chart receives the date filter.
- QTD → the full quarter to date
- Month-to-date and quarter-to-date show different source periods.
- YTD → every month up to the endpoint
- The chart expands from one month to the year-to-date range.
Rolling & fiscal periods
- Choose a rolling window
- 1D · 1W · 1M · 3M · 6M · 1Y · 2Y
- Use fiscal time intelligence
- Fiscal MTD, QTD and YTD respect the selected fiscal start month.
- Anchor a period to the current date
- Current month, quarter and year change the date window.
Custom ranges & clearing
- Set your own date range
- Choose both endpoints. Apply once. The chart follows the source rows.
- Clear one field or the whole set
- Fast reset controls make exploration easy to undo.
Responsive & collapsible
- Arrange horizontally or vertically
- The same slicers wrap and reflow as their container changes size.
- Reclaim space with the arrow
- Collapse the filters, keep the selections, expand when needed.
Connected report
- Explore a connected report
- Country and period selections work together on the real Charts visual.
Product screenshots