The detail behind every decision.
Give complex reporting structures room to breathe, with readable hierarchies and meaningful totals.
Financial reporting, product hierarchies and operational scorecards.
Table and chart views with expandable hierarchies
See the relevant feature demonstration below and review the Knowledge Base for setup and usage guidance.
01
Actual, prior-year and plan variance analysis
See the relevant feature demonstration below and review the Knowledge Base for setup and usage guidance.
02
Custom formulas, columns and subtotals
See the relevant feature demonstration below and review the Knowledge Base for setup and usage guidance.
01
Built for clearer reporting
Financial reporting, product hierarchies and operational scorecards.
Explore the screenshots and individual demonstrations below. Product compatibility, deployment and licensing are confirmed for your requirements.
- Table and chart views with expandable hierarchies
- Actual, prior-year and plan variance analysis
- Custom formulas, columns and subtotals
- Row search, conditional rules and Top N controls
PRODUCT LICENSING & SUPPORT
Let’s find the right fit.
Table & comparisons
- Start with a simple matrix
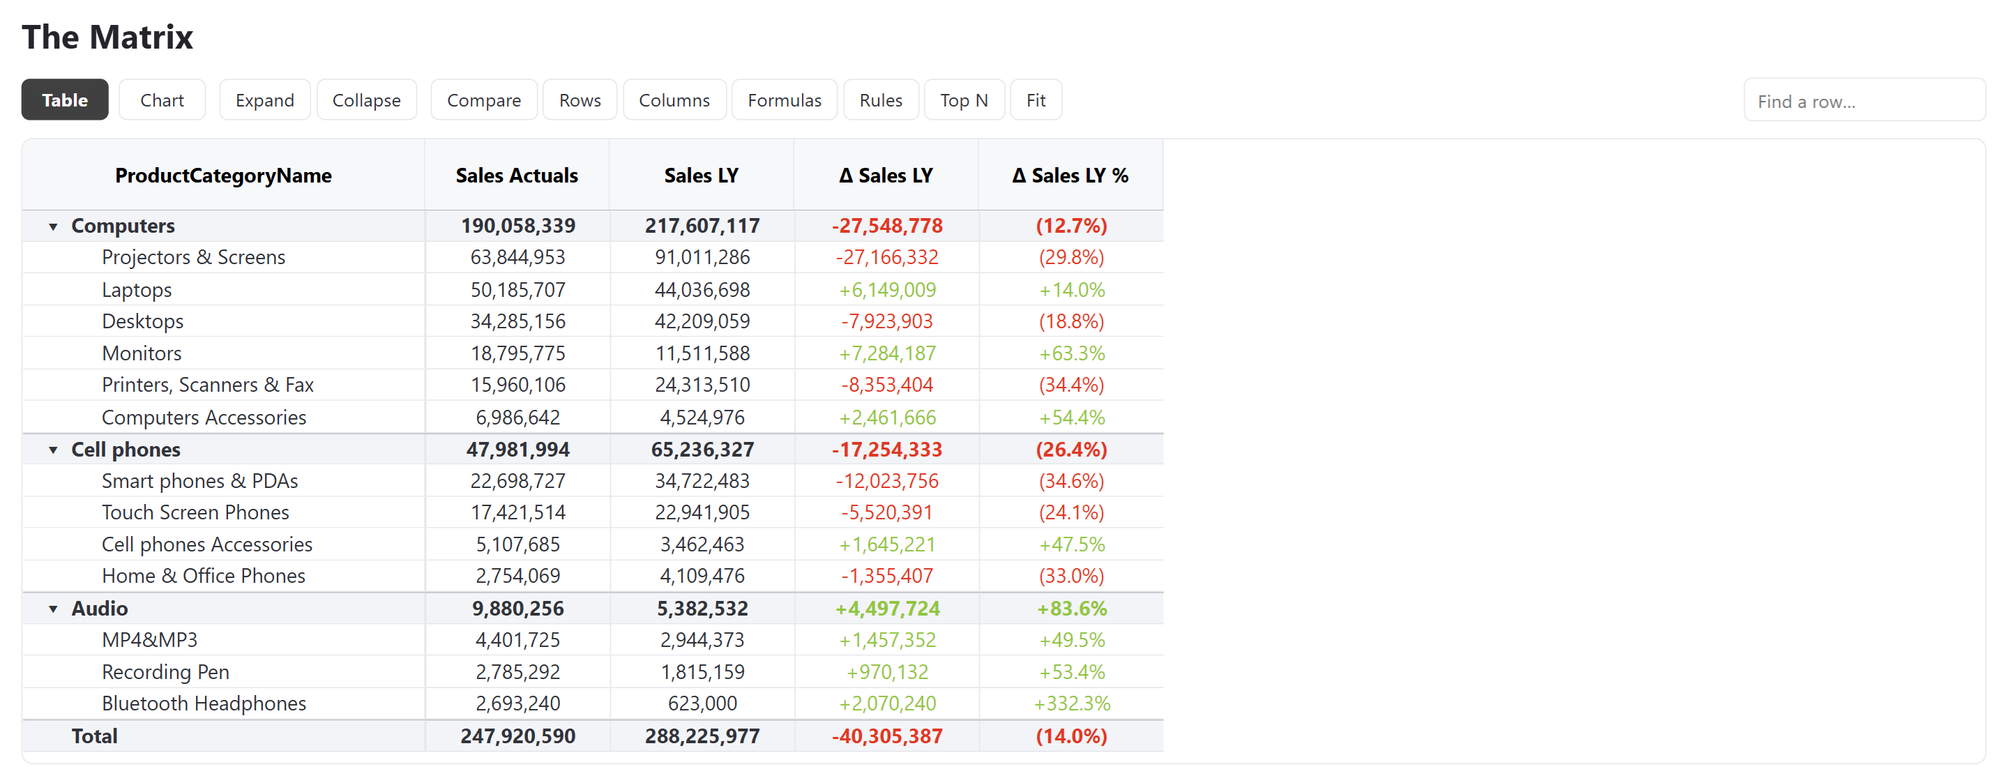
- Actual values, a familiar hierarchy and a readable total.
- Add variance columns
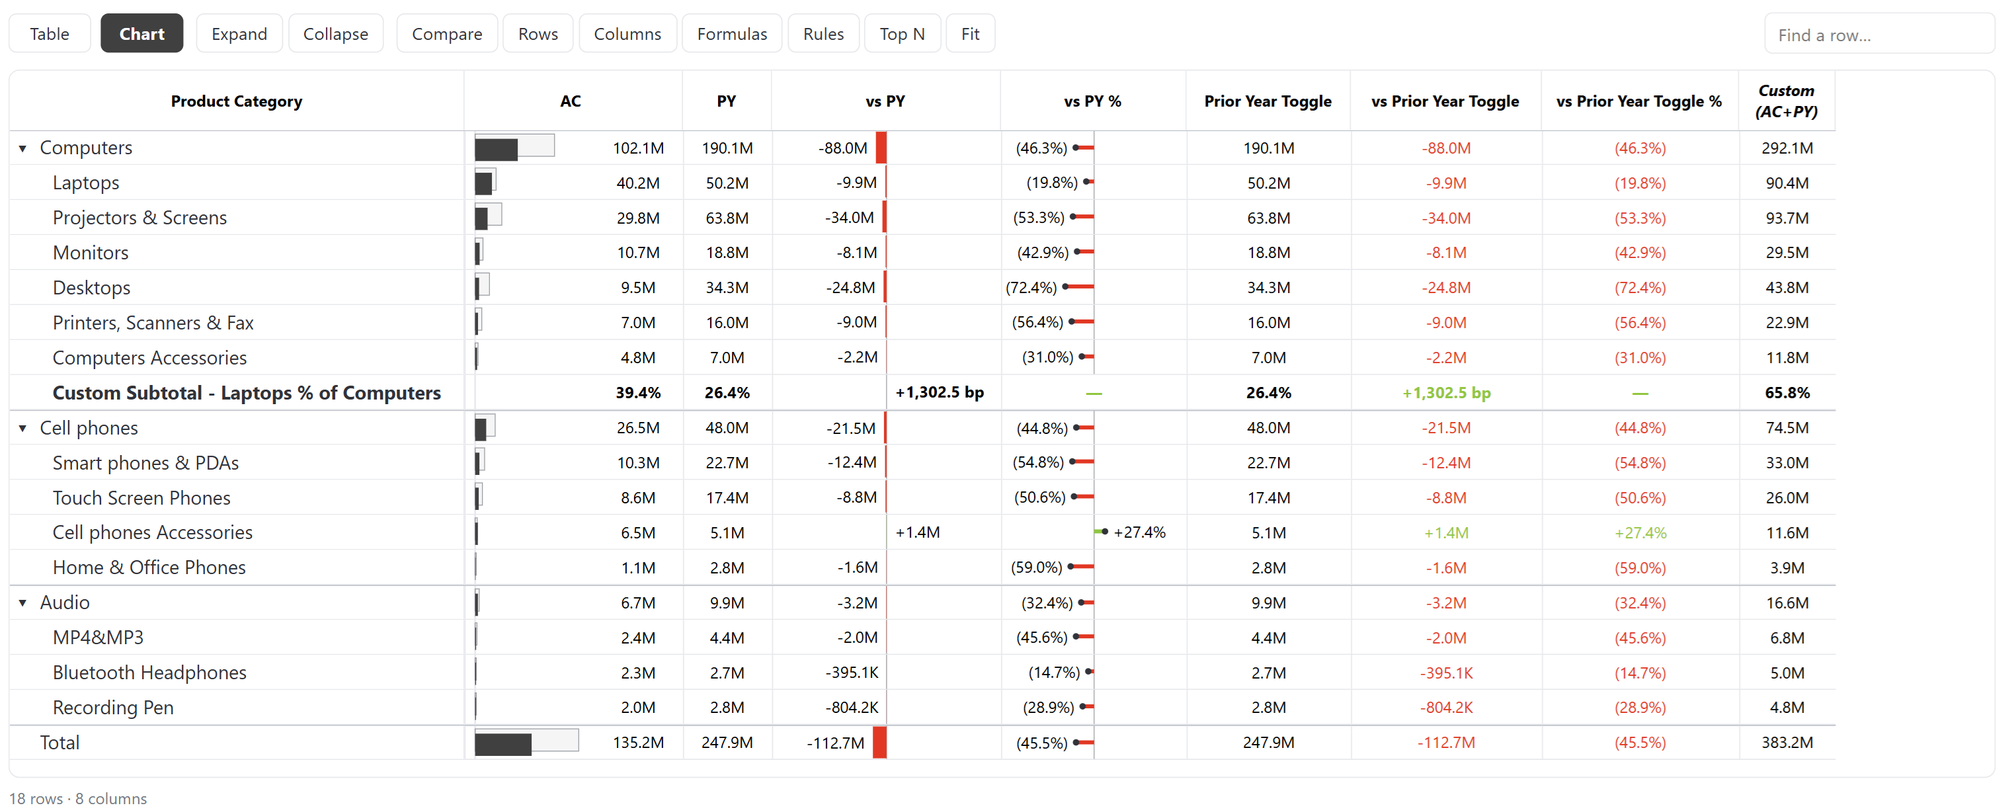
- Model values and business comparisons in the same table.
- Toggle between Table and Chart
- The same data changes presentation with one click.
Hierarchy & totals
- Explore the hierarchy
- Collapse a branch, then expand it again. Charts refit the visible rows.
- Add totals where they matter
- Hierarchy subtotals and a custom financial calculation.
- Subtotal rows and column groups
- Monthly groups, hierarchy subtotals and a fiscal total column.
IBCS financial layout
- Create a financial waterfall
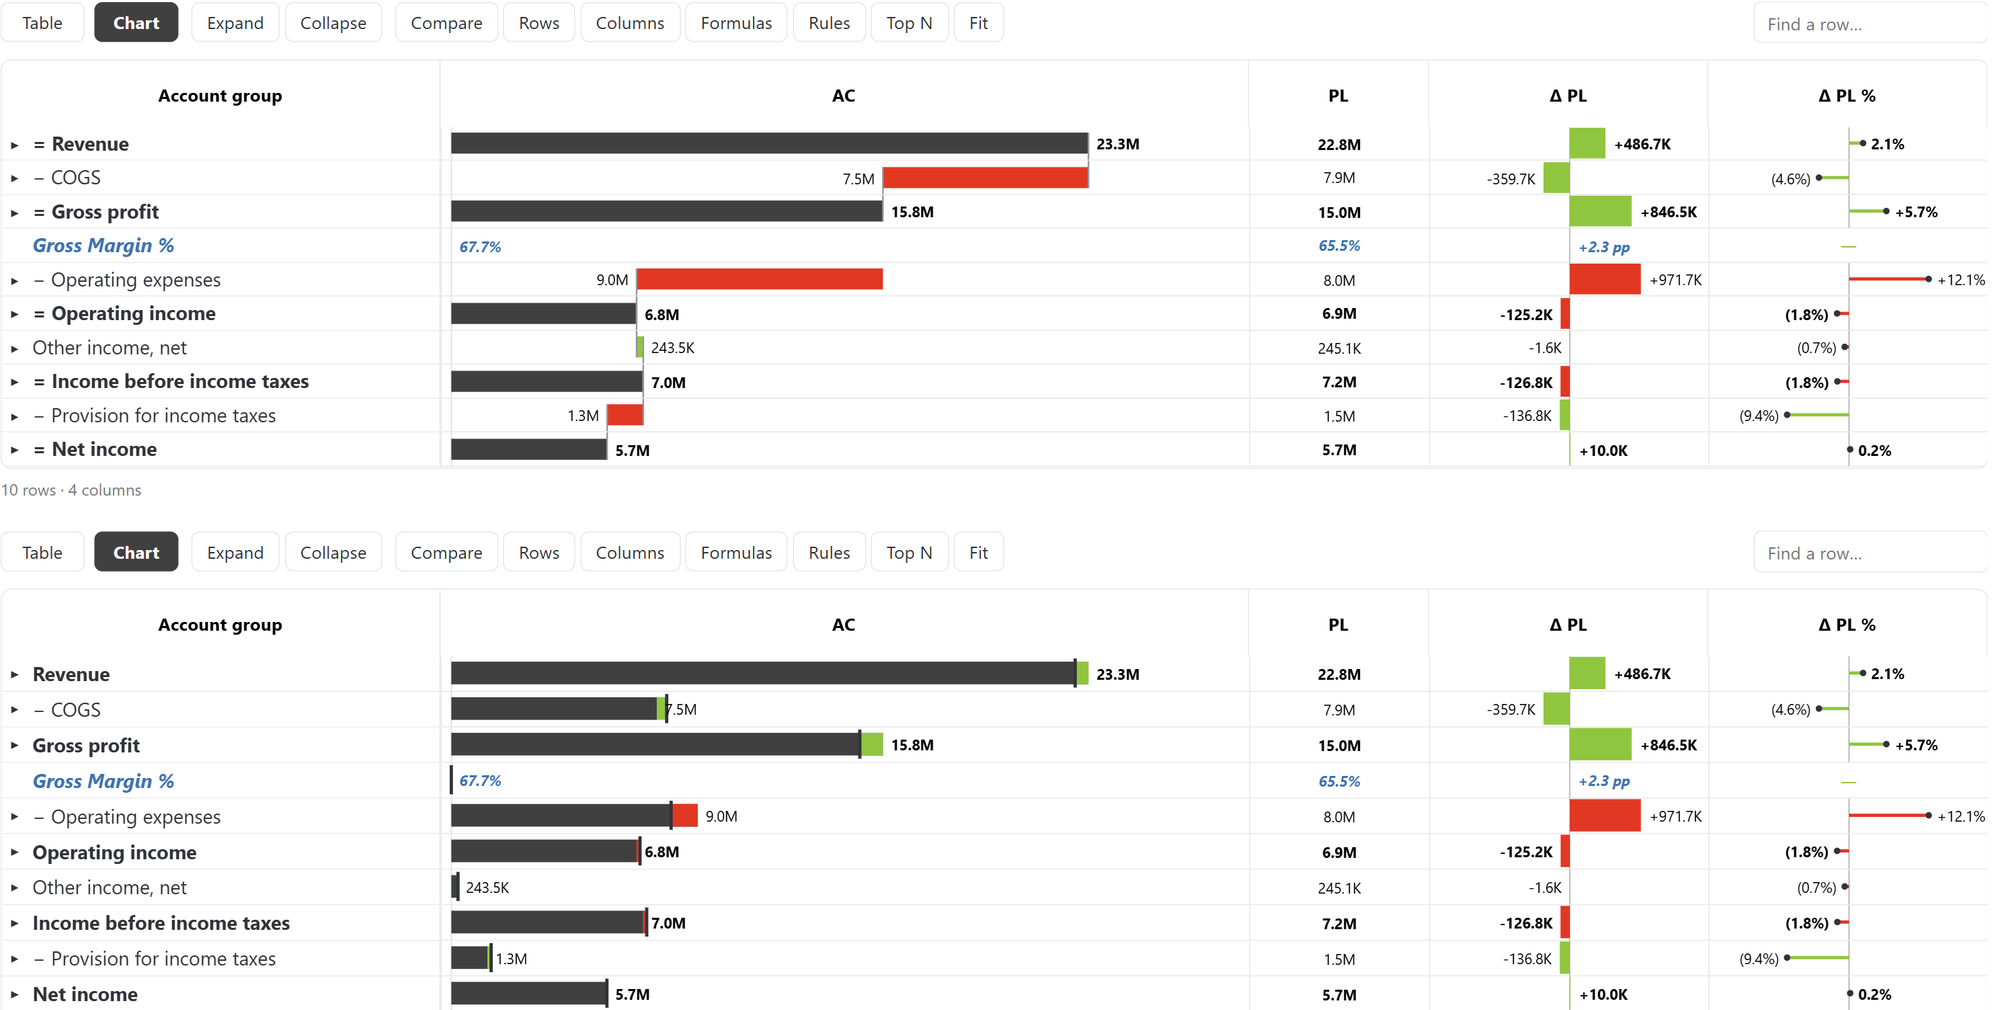
- IBCS actuals, plan values and favorable / unfavorable changes.
- Make any row a Result
- Open the row settings → Show as Result → Apply.
- Put the variance inside the bar
- IBCS columns, reference styles and integrated differences.
All cell chart types
- Sparklines in every row
- Line, column, area, opaque area and color sparklines.
- Progress, gauges and states
- Progress bars, bullet gauges, radial gauges, pie and state.
- Choose the comparison geometry
- Bar, overlapped bar, data bar, bullet and integrated variance.
- Use points when bars are too much
- Dots, sized dots, lollipops, dumbbells and variable states.
- Keep the variance explicit
- Variance bars, pins and formatted numbers.
Responsive financials
- Fit the report to the available space
- Charts and comparison columns combine and return as the visual widens.
Product screenshots