Choose running, variance or snapshot logic first; the renderer then follows that meaning.
Twelve variants, with real examples
| Variant | Fields to bind | Calculation | Project sample |
|---|---|---|---|
| Simple waterfall | Category + Actual | Contributions run from zero; Results anchor balances | |
| Variance waterfall | Category + Actual + comparison | Bridge Reference → Actual, or reverse | |
| Combination waterfall | Category + Actual + comparison | Bridge plus period columns and optional scenario anchor | |
| Stacked waterfall | Category + Actual + Breakdown, or multiple Actual measures | Each contribution and total has stacks | |
| Stacked variance waterfall | Category + Actual + comparison + Breakdown | Stacked deltas bridge scenario totals | |
| Breakdown waterfall | Category + Actual + Breakdown, or multiple Actual measures | Category anchors with member changes between snapshots | |
| Stacked breakdown waterfall | Category + Actual + two Breakdown fields | First breakdown names change bars; second supplies stacks | |
| Continuous waterfall | Parent → child Category hierarchy + Actual | Balance carries between parent groups | |
| Regular / segmented waterfall | Parent → child Category hierarchy + Actual | Each parent starts from zero | |
| Measure waterfall | Multiple Actual measures; Category optional | Measures become ordered contributions | |
| Side-by-side waterfall | Category + Actual + scenarios or multiple Actual measures | Parallel running lanes with common scale | |
| Layered running waterfall | Multiple Actual measures or Breakdown members | Each lane starts at the previous lane’s ending balance |
Main measure and reference
Set Main measure and Comparison measure explicitly when several are bound. Auto can use a comparison scenario or the second Actual measure. For Variance/Stacked variance, Bridge direction chooses Reference to Actual or Actual to Reference. Comparisons match within the same breakdown member.
Model endpoints and reconciliation
Model totals preserve supplied endpoints. Displayed categories sums received contributions and is appropriate only for additive data. If category changes do not reconcile, enable Show reconciliation bar for a Context adjustment or Unallocated change. It is Off by default. The tooltip identifies the displayed balance and model difference.
Running is not variance
Running waterfalls accumulate signed values. Variance waterfalls accumulate differences. Breakdown waterfalls explain transitions between snapshot totals and end at the last snapshot, not the sum of all snapshot totals.
Readable contribution labels
Auto units are chosen per displayed waterfall amount, so a billion-scale anchor can coexist with million-scale changes. Axis ticks retain a common unit scale. Explicit series units remain authoritative. Keep original values available in tooltips.
Price–Volume–Mix is a model-driven bridge
Use a disconnected ordered step table and a SWITCH measure, then select Simple waterfall and mark its opening/closing balances as Results. The visual renders the bridge; its Price, Volume and Mix measures are explicitly defined in Price–Volume–Mix: from Sales LY to Sales Actuals.
Choose the right waterfall calculation
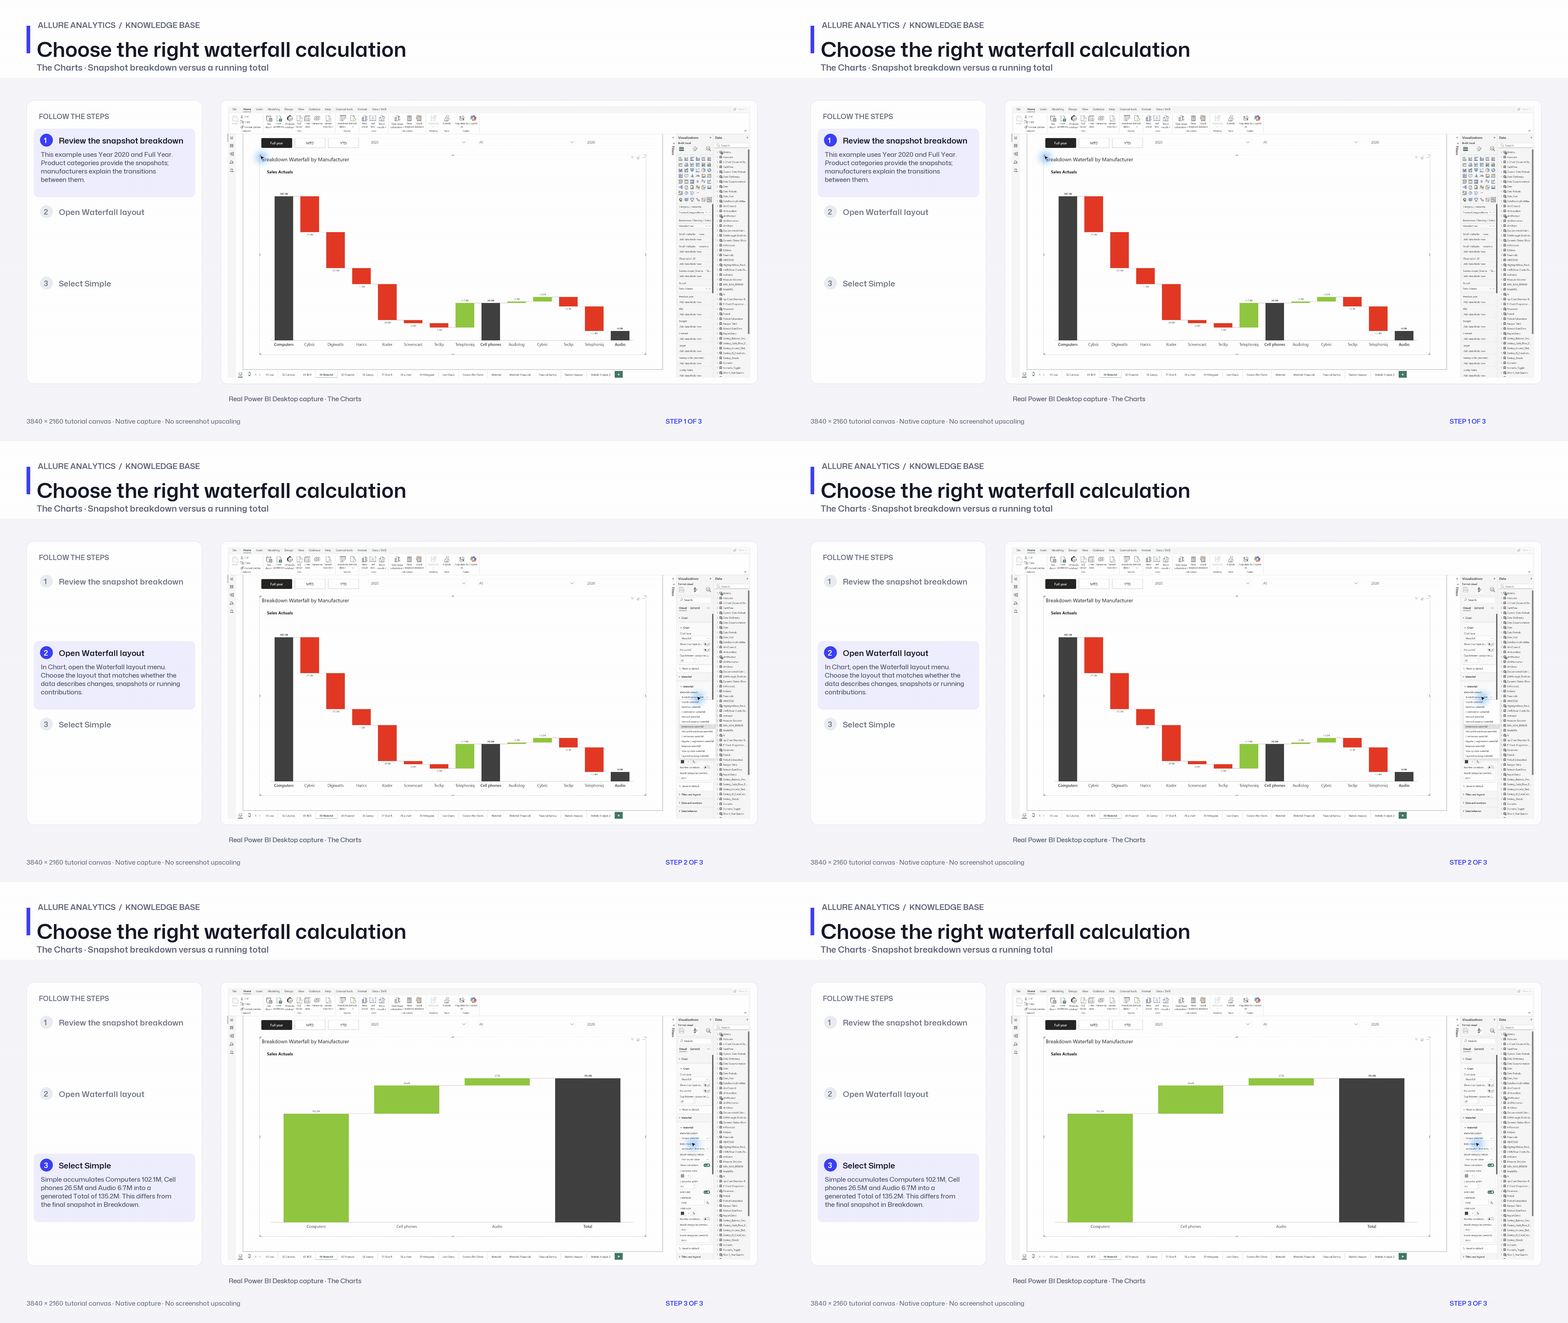
Native Breakdown-to-Simple waterfall chapter using the supplied model. Other waterfall families remain in the article.
3840 × 2160 tutorial canvas at 20 fps. Real 2560 × 1392 Power BI Desktop screenshots retain their native size; this is a paced step sequence.
- Review the snapshot breakdown — This example uses Year 2020 and Full Year. Product categories provide the snapshots; manufacturers explain the transitions between them.
- Open Waterfall layout — In Chart, open the Waterfall layout menu. Choose the layout that matches whether the data describes changes, snapshots or running contributions.
- Select Simple — Simple accumulates Computers 102.1M, Cell phones 26.5M and Audio 6.7M into a generated Total of 135.2M. This differs from the final snapshot in Breakdown.