Show magnitude, reference and business status in a compact horizontal chart.
Choose a bullet style
| Style | What it shows |
|---|---|
| IBCS difference | Actual over a wider reference, with a thin favorable/unfavorable difference overlay |
| Comparative | Actual and reference without the status difference overlay |
| Qualitative ranges | Actual against three threshold bands and a goal marker |
Configure it
Choose Bullet Progress Bar in Trend chart. Bind the Actual and reference totals as for Progress Bar; no Trend axis is needed. Format the reference height, color/transparency, difference thickness and zero line. The reference marker can be Line, Circle, Square, Triangle or Off.
Bullet Progress with IBCS difference overlay and reference marker.
Click to enlarge.
Labels and thresholds
Set thresholds as percentages of the reference or absolute amounts. The scale includes Actual, Reference, zero and the qualitative endpoints, and expands beyond the goal. Configure actual/reference text, completion percentage, units, placement and colors. Tooltip variance percentage uses the absolute reference denominator for this chart.
In a grouped card, selecting the bar uses the group identity. It does not synthesize a date selection for a total-only chart.
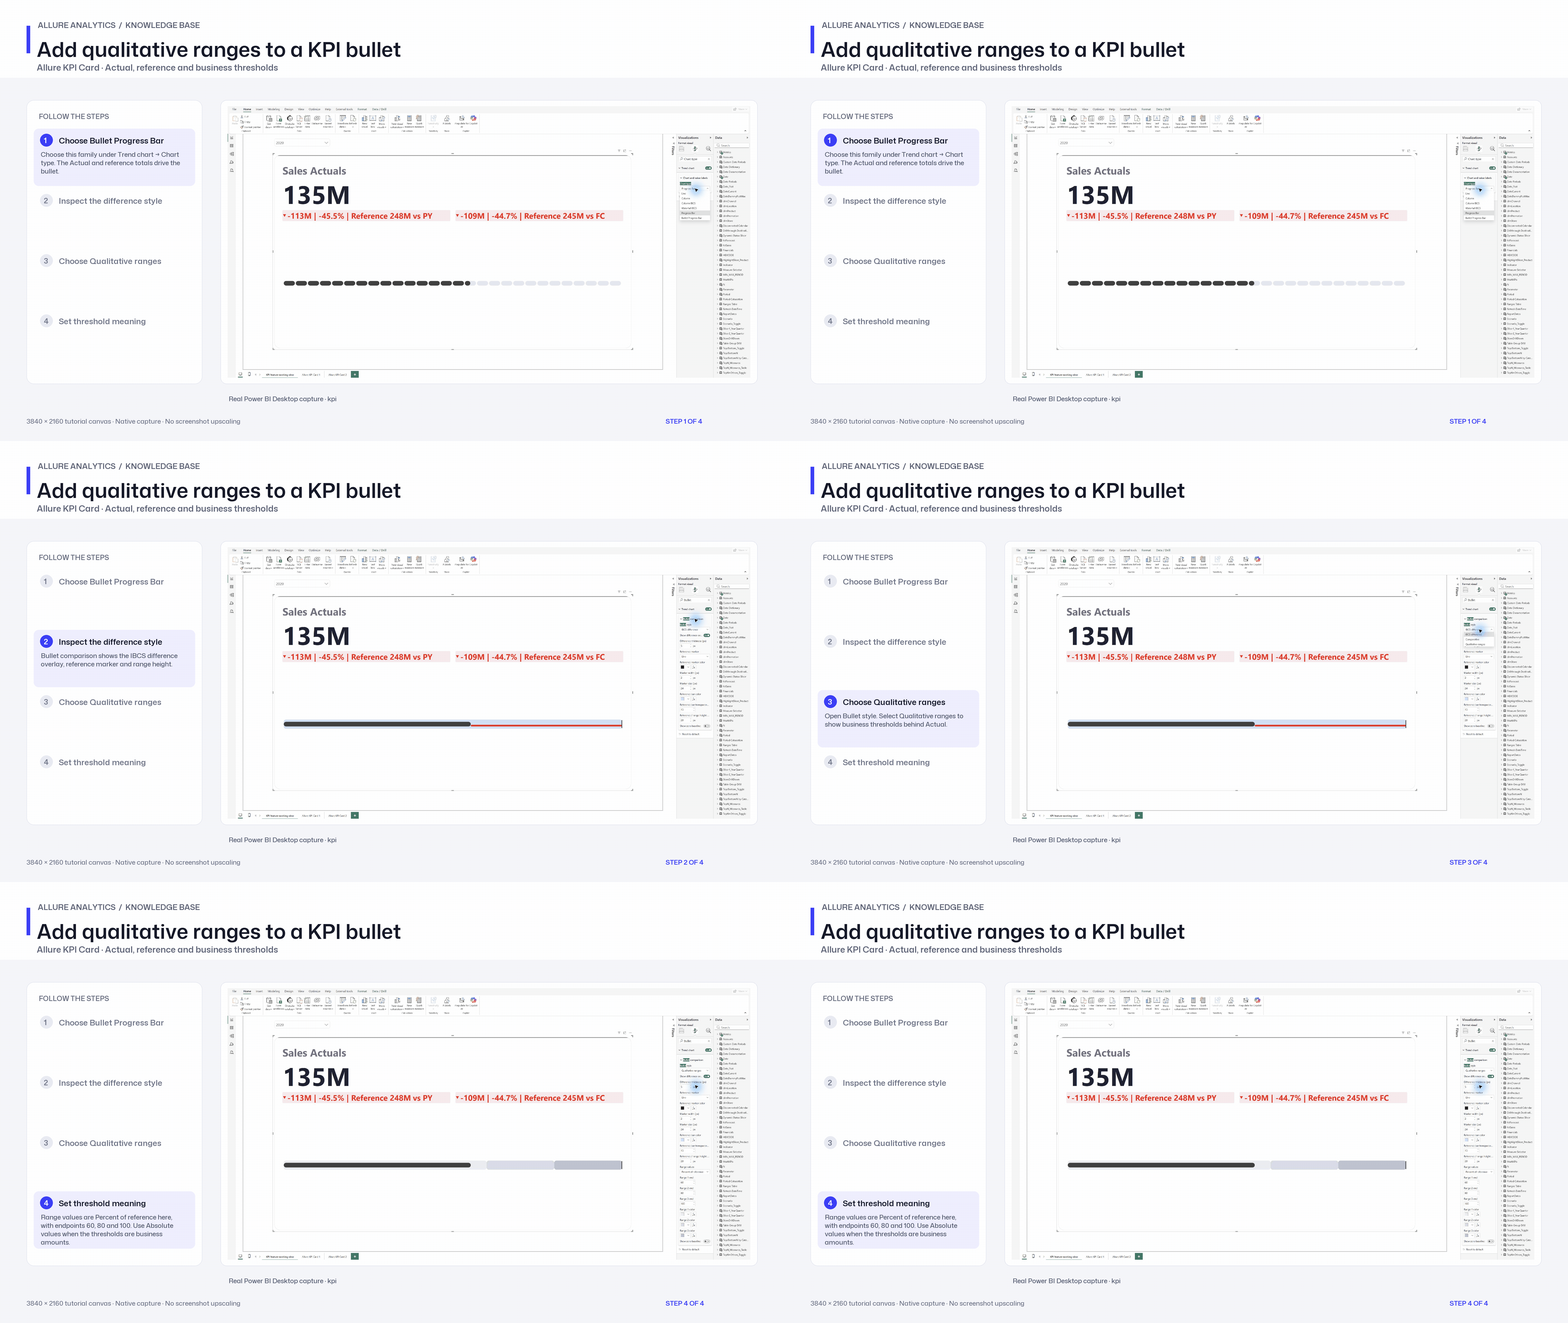
Add qualitative ranges to a KPI bullet
Bullet family, difference overlay and qualitative-range configuration chapter.
3840 × 2160 tutorial canvas at 20 fps. Real 2560 × 1392 Power BI Desktop screenshots retain their native size; this is a paced step sequence.
- Choose Bullet Progress Bar — Choose this family under Trend chart → Chart type. The Actual and reference totals drive the bullet.
- Inspect the difference style — Bullet comparison shows the IBCS difference overlay, reference marker and range height.
- Choose Qualitative ranges — Open Bullet style. Select Qualitative ranges to show business thresholds behind Actual.
- Set threshold meaning — Range values are Percent of reference here, with endpoints 60, 80 and 100. Use Absolute values when the thresholds are business amounts.