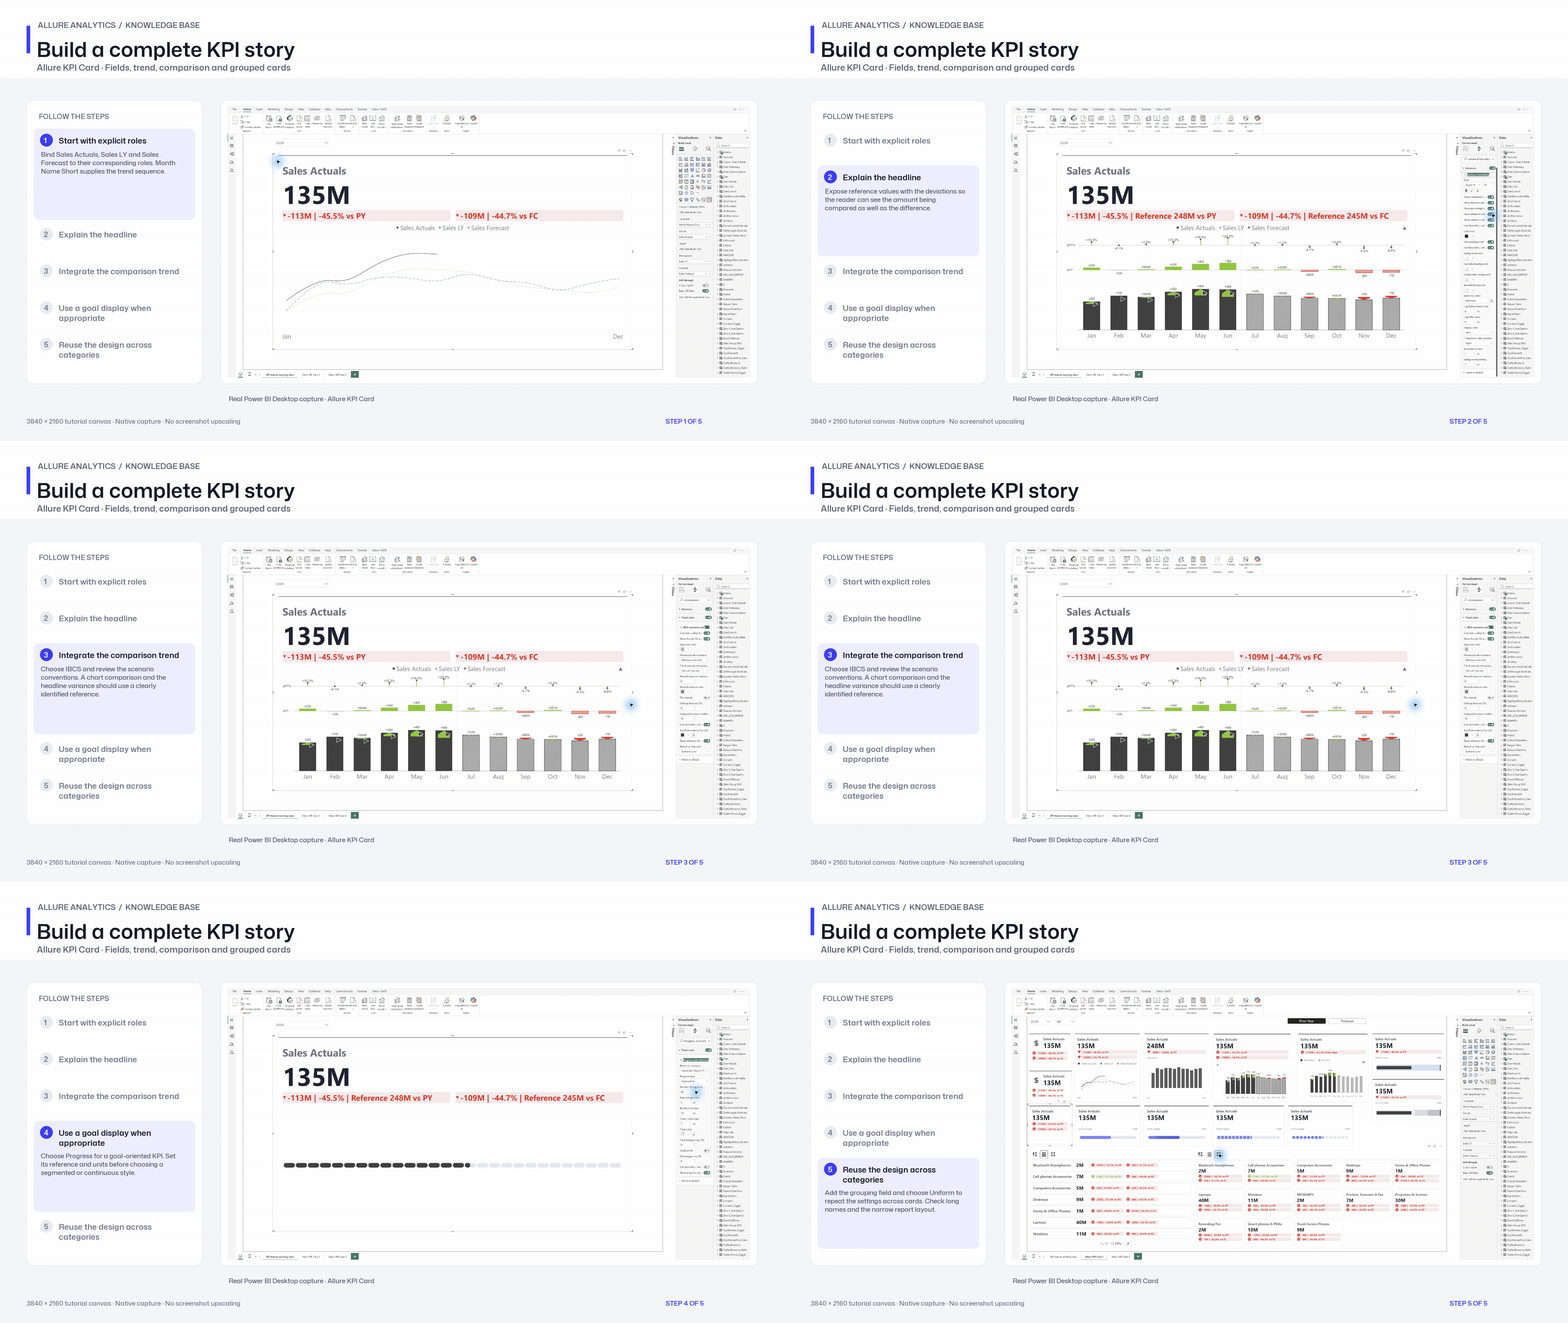
Headline cards, comparison trends, IBCS plots, progress, bullet progress and category layouts using one documented set of bindings.
The field set
Real renderers, explicit sample fields
These figures were captured from the unchanged current .pbiviz packages with documented sample data. They preserve the referenced chart families and variants. Your screenshots are included in Reference gallery. Full source data was not attached; example values are illustrative unless transcribed from a visible table. Field names and binding roles are explicit, and each example includes downloadable sample data.
KPI field well
Example field
Meaning
Actual
[Sales Actuals]
Evaluated headline and trend values
Prior period
[Sales LY]
Year-over-year reference
Forecast
[Sales Forecast]
Outlook reference
Trend axis
Date[Month Name Short]
Jan–Dec, sorted by Month Number
Group / Category (KPIs)
Product[ProductSubcategoryName]
Optional category cards
Headline, line, area and columns
Headline and two variances
Fields and settings
Field well
Real field / measure
Actual
[Sales Actuals]
Prior period
[Sales LY]
Forecast
[Sales Forecast]
Trend axis
Date[Month Name Short]
Trend chart Off
Variances: PY and Forecast; triangle icons
Comparison line
Fields and settings
Field well
Real field / measure
Actual
[Sales Actuals]
Prior period
[Sales LY]
Forecast
[Sales Forecast]
Trend axis
Date[Month Name Short]
Trend chart → Line; Prior period and Forecast On; smooth curve
For Area, select the Line trend and enable Fill area. Bar uses the chart’s column rendering and applicable bar settings; marker and line-fill controls disappear. A comparison line is a scenario series, not an invented prior-period calculation.
IBCS trends and missing Actual periods
IBCS integrated column
Fields and settings
Field well
Real field / measure
Actual
[Sales Actuals]
Prior period
[Sales LY]
Forecast
[Sales Forecast]
Trend axis
Date[Month Name Short]
IBCS Column; Reference Forecast; variance colors On; totals shown for this example
IBCS rectangular variance
Fields and settings
Field well
Real field / measure
Actual
[Sales Actuals]
Prior period
[Sales LY]
Forecast
[Sales Forecast]
Trend axis
Date[Month Name Short]
IBCS Column; Reference Prior period; Variance display Bar
The supplied reference has Actual values through June and Forecast throughout the year. Use Forecast as the reference and its scenario display/continuation controls for the remaining periods. The two IBCS trend types in the card retain their own controls; the full 22 main-chart catalog belongs to The Charts.
Trend chart → Bullet progress; ibcs; reference Prior period
Bullet progress with ranges
Fields and settings
Field well
Real field / measure
Actual
[Sales Actuals]
Prior period
[Sales LY]
Forecast
[Sales Forecast]
Trend axis
Date[Month Name Short]
Trend chart → Bullet progress; qualitative; reference Prior period
The illustrated progress is [Sales Actuals] ÷ [Sales LY]. In a goal-oriented report use Target instead, or bind a manual goal. Filling animation applies to continuous/segmented Progress, respects reduced-motion preferences, and changes neither the value nor the applied filter. Bullet progress adds a reference marker and optional ranges.
Bind ProductSubcategoryName to Group / Category. Rows aligns the summary and trend; Uniform uses shared sizes; Custom supports per-card sizes. These sample cards use four categories. The reference screenshot contains additional categories using the same binding. Card selections use the supplied category identity in every layout.
Native recipe tour using the supplied Contoso reporting context. It demonstrates representative reference layouts rather than every image variant.
3840 × 2160 tutorial canvas at 20 fps. Real 2560 × 1392 Power BI Desktop screenshots retain their native size; this is a paced step sequence.
Start with explicit roles — Bind Sales Actuals, Sales LY and Sales Forecast to their corresponding roles. Month Name Short supplies the trend sequence.
Explain the headline — Expose reference values with the deviations so the reader can see the amount being compared as well as the difference.
Integrate the comparison trend — Choose IBCS and review the scenario conventions. A chart comparison and the headline variance should use a clearly identified reference.
Use a goal display when appropriate — Choose Progress for a goal-oriented KPI. Set its reference and units before choosing a segmented or continuous style.
Reuse the design across categories — Add the grouping field and choose Uniform to repeat the settings across cards. Check long names and the narrow report layout.