Start with a familiar table, then add hierarchy, comparisons and chart columns.
Bind the fields
| Field well | Example | Purpose |
|---|---|---|
| Rows / hierarchy | Category → Subcategory → Product | Hierarchy labels and row identities |
| Columns / groups | Month or MTD/QTD/YTD | Optional repeated column groups |
| Actual | [Sales Actuals] | Primary numeric value |
| Previous period / year | [Sales PY] | Prior comparison |
| Plan scenarios / Budget scenarios / Forecast scenarios | [Sales PL], [Sales Budget], [Sales FC] | One or more comparison measures |
| Additional values | [Units], [Margin %] | Other numeric columns |
| Header / title context | [Selected year] | Dynamic text tokens |
| Text / comments; Hyperlinks; Images (base64) | Bound text or inline raster data | Optional row content |
Understand the defaults
A fresh v1.11.9 visual opens in Table. The Table button is on the left and Chart on the right. Row hierarchy text is left-aligned; column headings and values are centered. Subtotal rows default to Top; grand total stays Bottom. General accent is #404040.
The Matrix in its default Table view with grouped measures, subtotals and variance columns.
Click to enlarge.
Keep the controls you need
Layout → View and interaction → Show Chart/Table toggle is independent of Layout → Toolbar → Show toolbar. You can display either, both or neither. Use Chart for embedded quantitative marks; use Table for exact numbers. Formatting is saved independently per view.
Set up a Matrix analysis
Native setup chapter on the supplied Matrix report.
3840 × 2160 tutorial canvas at 20 fps. Real 2560 × 1392 Power BI Desktop screenshots retain their native size; this is a paced step sequence.
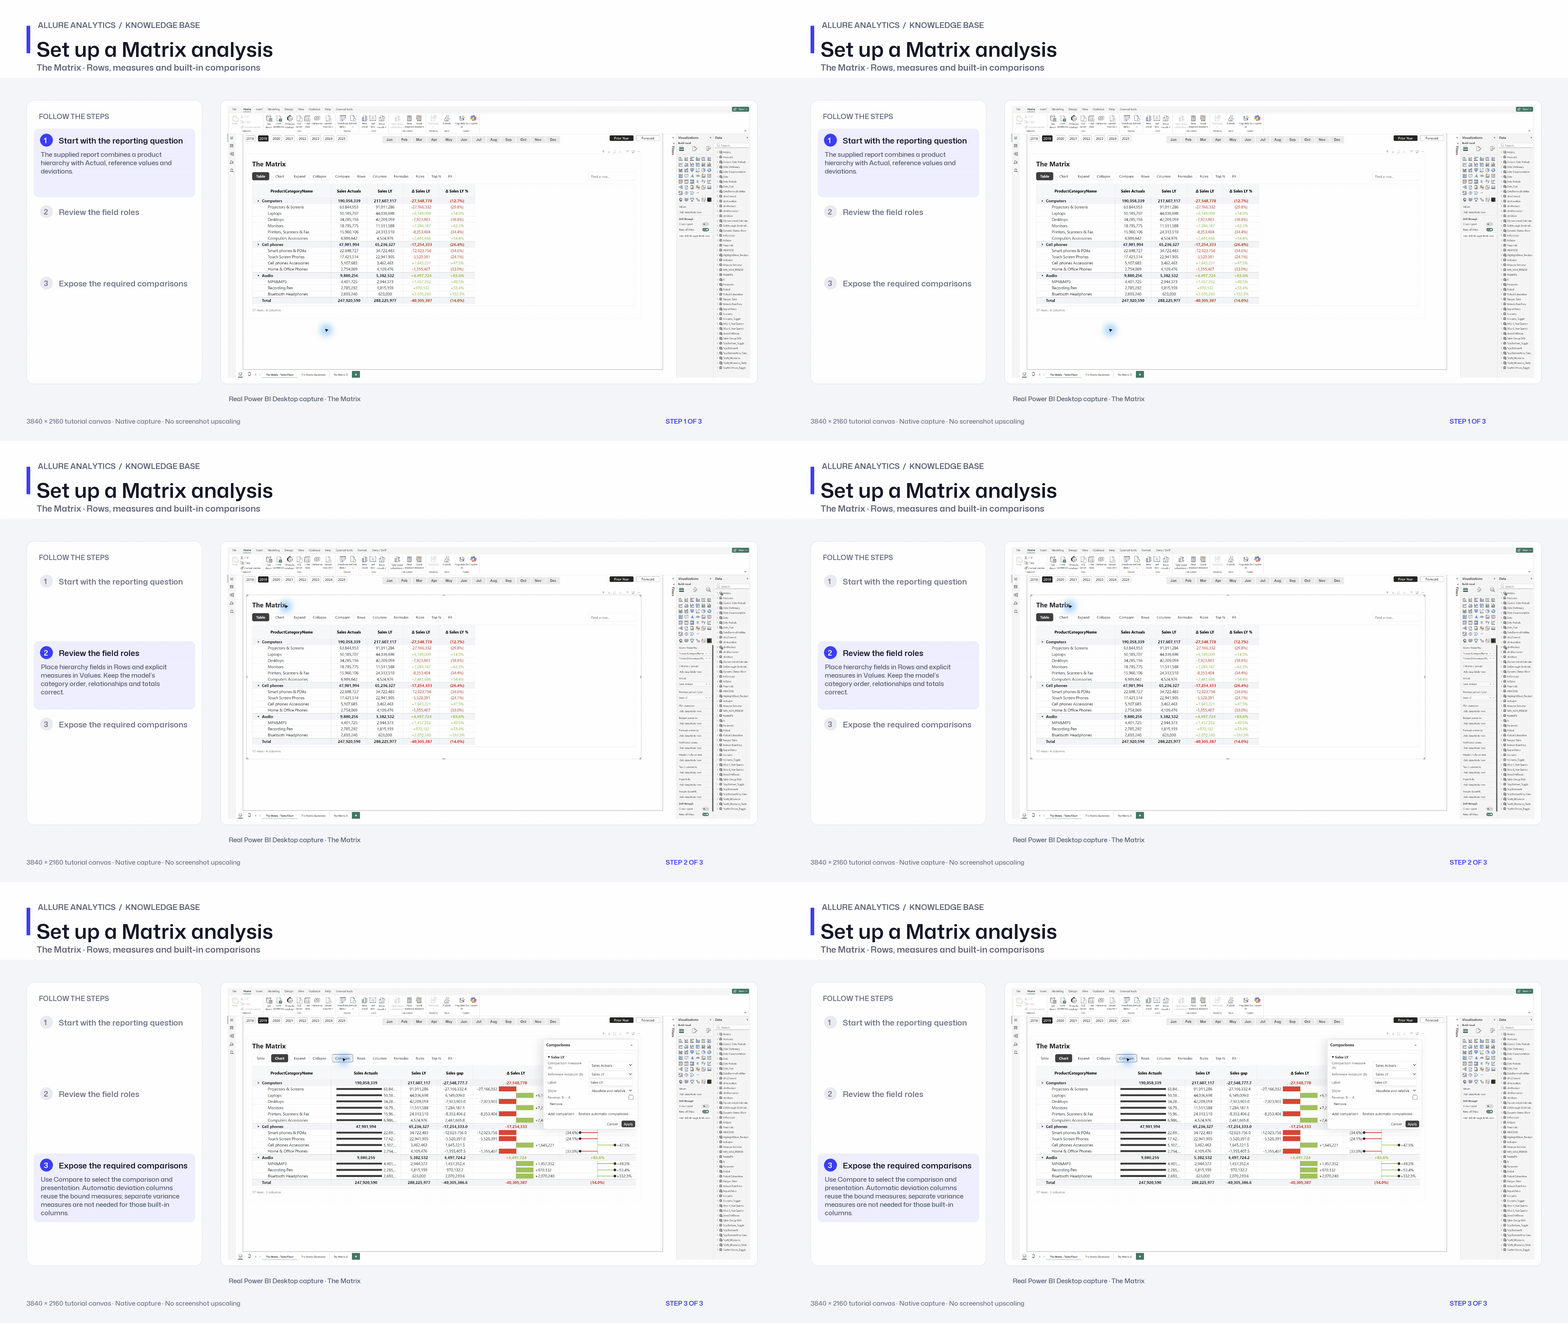
- Start with the reporting question — The supplied report combines a product hierarchy with Actual, reference values and deviations.
- Review the field roles — Place hierarchy fields in Rows and explicit measures in Values. Keep the model’s category order, relationships and totals correct.
- Expose the required comparisons — Use Compare to select the comparison and presentation. Automatic deviation columns reuse the bound measures; separate variance measures are not needed for those built-in columns.