
The best Power BI practices make a model easier to trust, maintain and use. Start with clear business definitions, then choose the modelling, DAX and report techniques that support those definitions.
Use explicit measures for shared business logic
An implicit aggregation is convenient for exploration. An explicit measure is easier to name, format, reuse and review when it represents a business metric used throughout a report.
DAX
Sales Amount = SUM ( Sales[SalesAmount] )

Gross Profit = [Sales Amount] - [Cost of Sales]

Gross Margin % = DIVIDE ( [Gross Profit], [Sales Amount] )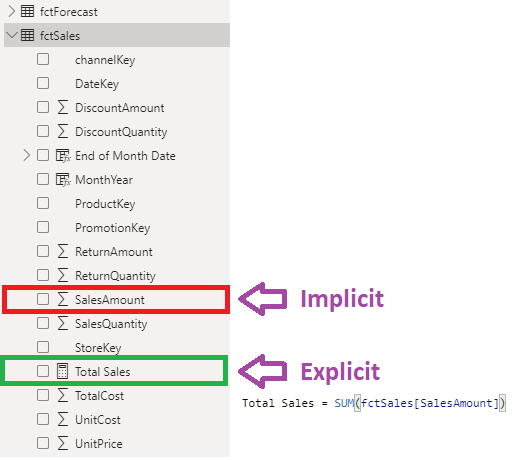
Keep base measures simple and build comparisons on top of them. A dedicated measures table and display folders help people find the right calculation; they do not change how the fact data is related.
Handle division and blanks deliberately
DIVIDE handles a zero or blank denominator and returns BLANK by default. This is useful when a missing ratio should remain missing. Use an alternate result only when that value has a clear business meaning. A fixed, known nonzero denominator can use the normal division operator.
DAX
Sales per Unit = DIVIDE ( [Sales Amount], [Units Sold] )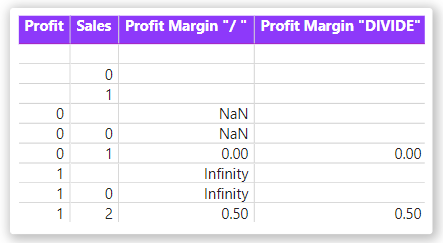
Blank and zero are different statements. Converting every blank to zero can create categories that imply activity where none exists. The “Show items with no data” setting also affects what a visual displays.
Prefer readable conditional logic
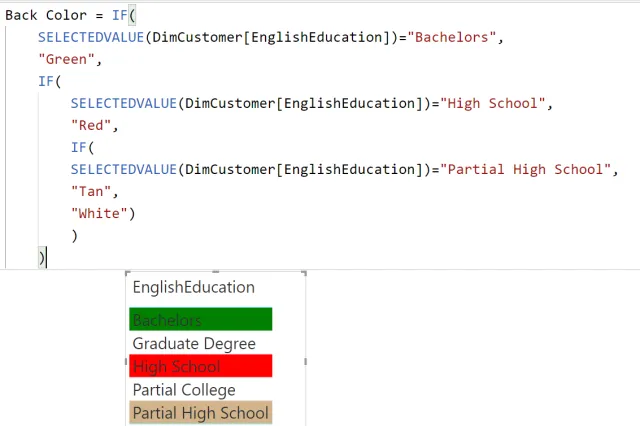
SWITCH(TRUE()) is often easier to maintain than deeply nested IF expressions when you have ordered conditions. Evaluate the most specific condition first and include an intentional fallback. Readability alone does not guarantee faster execution.
DAX
Performance Band =
VAR Margin = [Gross Margin %]
RETURN
    SWITCH (
        TRUE (),
        ISBLANK ( Margin ), BLANK (),
        Margin < 0, "Loss",
        Margin < 0.15, "Review",
        "On track"
    )
Model before optimising individual measures
- Write down the grain of each fact table before combining data.
- Use dimension tables to provide consistent filtering and grouping.
- Import the rows and columns the reporting scope needs.
- Review high-cardinality columns and data types for both accuracy and model size.
- Choose calculated columns when you need stored row attributes; choose measures for calculations evaluated in filter context.
A star schema is a strong starting point. Do not duplicate a fact table merely to create a dimension, and do not assume that every transformation belongs in DAX. Use the source or Power Query when that is the clearer place to prepare data.
Choose interactions for the reporting task
Cross-filtering and cross-highlighting are both useful. Select the behaviour that helps the reader answer the question on the page. A visual-level filter is appropriate when it intentionally limits that visual; a report-wide definition should live at the right shared level.
For models with a shared date dimension, review auto date/time and automatic relationship detection. Their convenience in a small exploration model can become confusing in a model with several facts and date roles.
Measure performance with real queries
Use Performance Analyzer and representative report interactions to find bottlenecks. Test expensive visuals, slicer combinations and totals. Changing a measure’s formatting or replacing an IF expression without measuring the effect is not a performance strategy.
- Use descriptive names and consistent formatting.
- Document important assumptions beside the measure or model.
- Check totals, blank values and incomplete reporting periods.
- Review report pages with real users performing real tasks.
- Keep a record of the changes that improve measured performance.
A useful convention is one your team can apply consistently. Treat best-practice rules as review prompts, then explain any justified exceptions.
Complete DAX and Power Query reference
The following reference retains every substantive code example from the supplied article, including alternative approaches and examples that demonstrate a problem. Table names and historical date ranges are preserved. Compare these alternatives with the updated guidance above before adapting them to your model.
Profit Margin
DAX
Profit Margin = [Profit] /[Sales] – Not recommended
Profit Margin = DIVIDE([Profit], [Sales]) – Recommended
Sales (Blank to 0)
DAX
Sales (Blank to 0) =
IF(
    ISBLANK([Sales]),
    0,
[Sales]
)
Profit Margin
DAX
Profit Margin = DIVIDE([Profit], [Sales]) – RecommendedProfit Margin (No Blank and zero)
DAX
Profit Margin (No Blank and zero) =
IF(
    OR(
        ISBLANK([Sales]),
        [Sales] == 0
    ),
    BLANK(),
    [Profit] / [Sales]
)
Full source narrative and setup notes
Read every original instruction and explanation
This reference preserves the original article’s prose, setup steps and small inline expressions. Historical interface labels and recommendations are retained for comparison with the updated guidance above.
· Write Explicit measures in DAX instead of Implicit
In PBI Desktop, any column with numerical values can be used as a measure in a visualization, or it can be referenced in a measure. When you use such a column, it’s an implicit measure. When you write a DAX formula to create a measure, it’s an explicit measure. The best practice is to use explicit measures everywhere, even for simple measures like sum, min, max and average. The reason behind this is that if you use implicit measures in the formula of other measures and at some point, the business logic changes – meaning you need to write a formula for this basic measure – you will need to update every single measure where this base measure was used. Explicit measures promote reusability and make it easier to refactor your code.
In your model, you can recognize implicit measures by the summation symbol ∑ (sigma), and explicit measures by the calculator icon.
Ideally, every numerical column which might lead to implicit measures is hidden (with the exception of a column containing years or months for example) and explicit measures are created on top of those columns.
Using DIVIDE function instead of divide operator (/)
As a data modeler, when you write a DAX expression to divide a numerator by a denominator, you can choose to use the DIVIDE function or the divide operator (/ – forward slash).
It’s recommended that you use the DIVIDE function whenever the denominator is an expression that could return zero or BLANK()
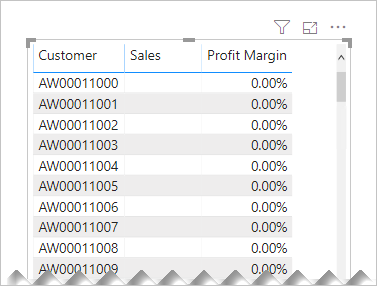
Consider the following measure definition that explicitly converts BLANK results to zero:
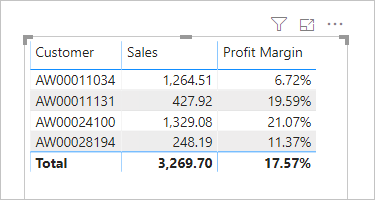
The table visual displays an overwhelming number of rows. (There are in fact 18,484 customers in the model, and so the table attempts to display all of them.) Notice that the customers in view haven’t achieved any sales. Yet, because the Profit Margin measure always returns a value, they are displayed.
Let’s see what happens when the Profit Margin measure definition is improved. It now returns a value only when the Sales measure isn’t BLANK (or zero).
The following measure expression produces a safe division, but it involves using four DAX functions.
This measure expression achieves the same outcome, yet more efficiently and elegantly.
· Import only the columns that are necessary.
Filtering the columns after the import won’t help you to avoid stressing the performance.
· It’s better / faster to have long tables with more rows than wide tables with more columns.
Therefore, consider using the unpivoted tables and getting narrow and long tables.
· Creating dimension tables (lookup tables).
By duplicating the fact table and removing duplicates helps to ensure consistency of both.
· Using Star Schema is preferred instead of the Snowflake Schema in terms of performance.
This means best case there is one fact table with several dimension tables around it.
· Whenever possible a Measure is preferred over a calculated column.
A measure calculates only when it is used in a visualization for the parts of the column while a column is calculated for the whole report and column.
· Create Measure’s Table
To find measures easier, there should be one central place for these measures or so-called measure’s table. In case of more than one table you can create a dedicated table for the measures and shift the measures to this place.
By changing the “display folder” name you can structure the measures along appropriate folders.
· Turn off Auto/Date time – global settings
· Turn off Auto relationship
· Use cross-filtering instead of cross-highlighting
· Avoid visual level filters
It is static and can change. Also, using measure you need to change only one time, and this is changed everywhere the measure is used in the report, not need to change every visual filter in all pages.
Use SWITCH function instead of nested IFs.
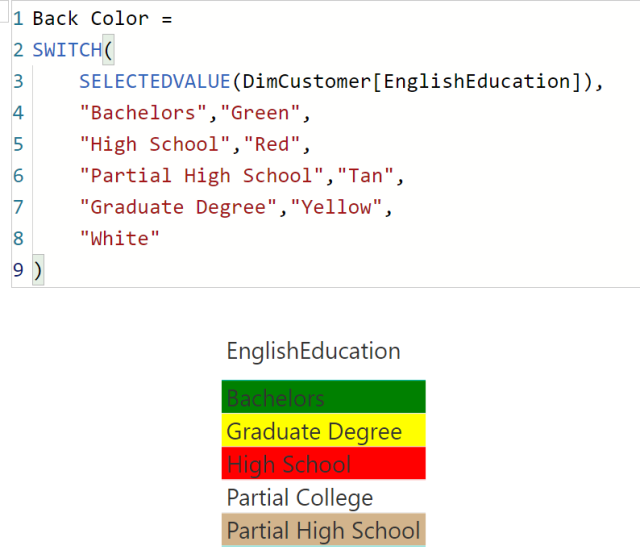
This makes code easier to read
Typical excel based nested IFs:
The same condition using SWITCH
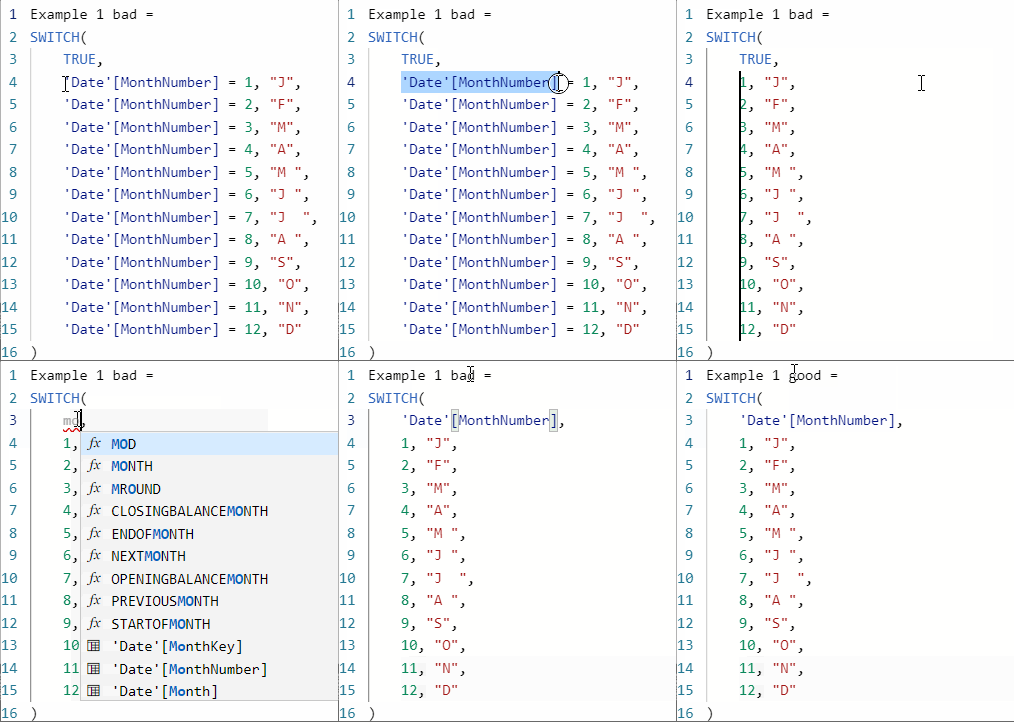
Optimization of SWITCH
Note: to remove all instances of a text string, select the text, press Ctrl + Shift + L and delete: