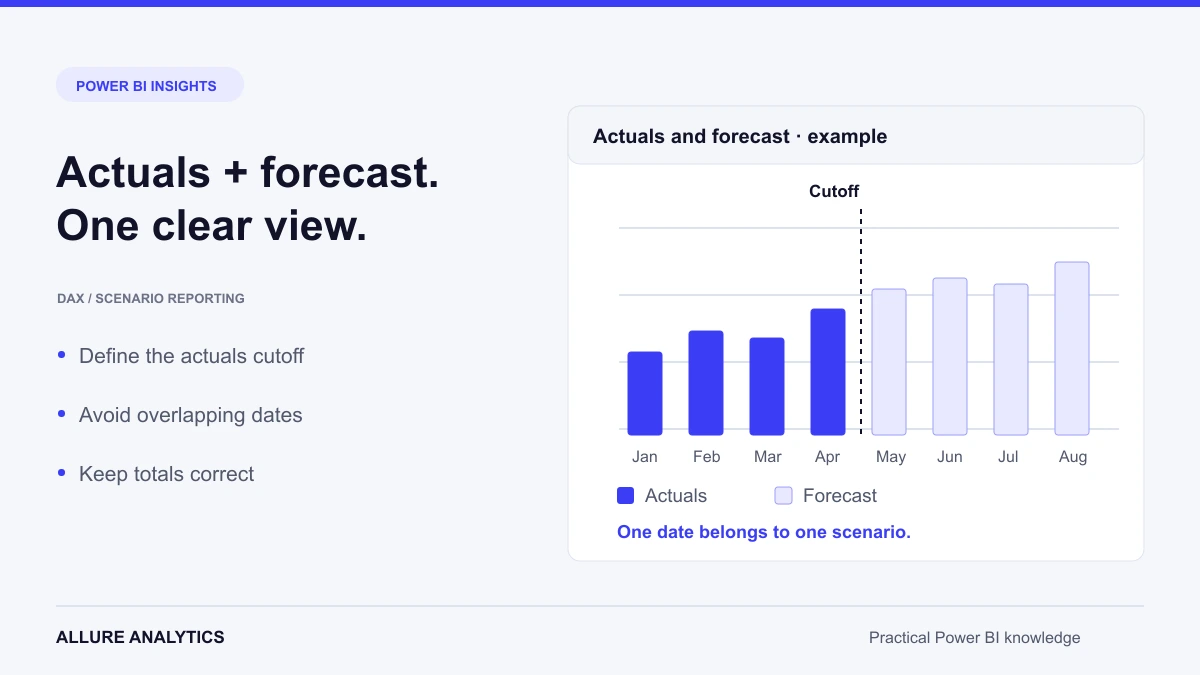
Show actual results and future forecast values in a single visual, while keeping the transition and the two scenarios easy to distinguish. This walkthrough covers both a completed-month boundary and an incomplete current month.
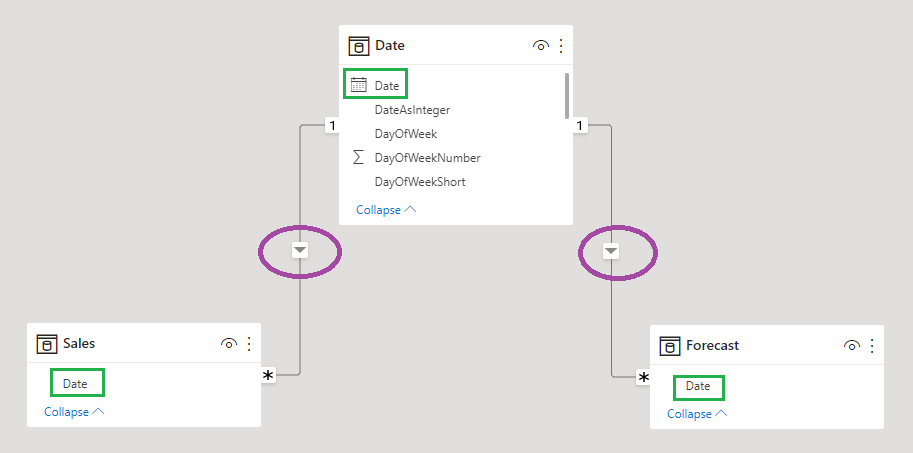
Start with a shared calendar table related correctly to both the Actuals and Forecast facts. Use the calendar for the visual’s time axis and slicers. The calendar-table article explains how to create it; the final section below shows the intended model relationships. How to create a calendar table you will find in another article.
Forecast after the last completed sales month
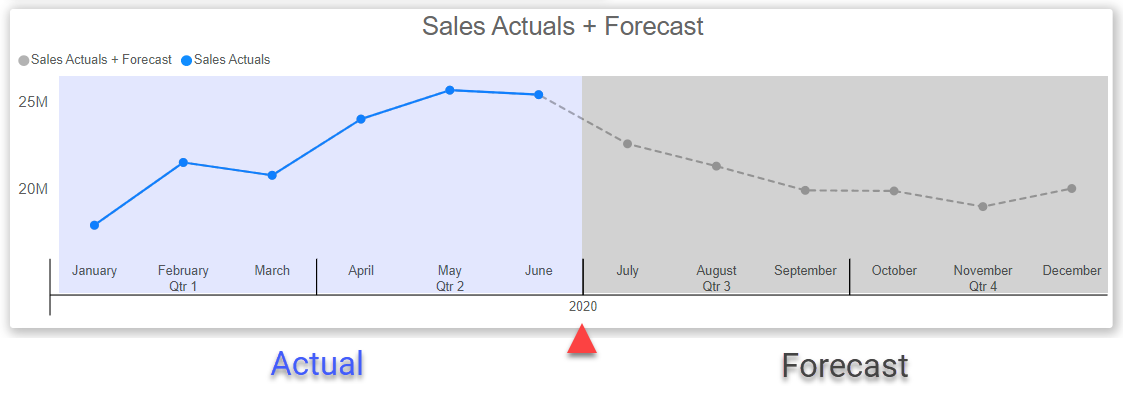
In the first scenario, June is complete. Actual values are shown through the last sales date, and forecast values begin after that boundary.
The example model contains separate Sales Actuals and Forecast tables.
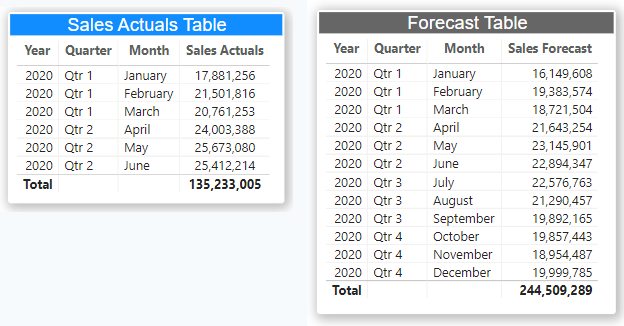
Create the two base measures used by the visual.
Sales Actuals = SUM(Sales[SalesAmount])Sales Forecast = SUM(Forecast[ForecastAmount])Add the measures to the visual’s Y-axis or Values field.
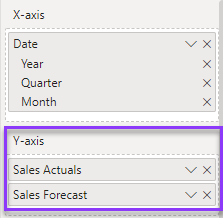
The initial visual shows the two series separately.
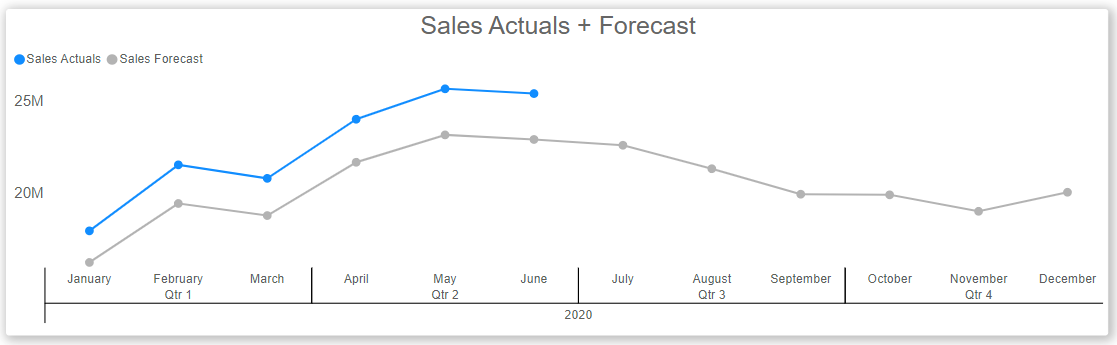
To make the transition appear continuous, plot a combined Actuals + Forecast measure together with Sales Actuals. The combined measure supplies actual values before the boundary and forecast values afterwards. Place Sales Actuals after the combined series in the illustrated field order so the overlapping actual portion is visually distinct.
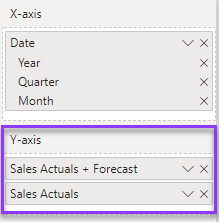
First identify the last sales date independently of the visual’s date context. A simple IF that chooses Actuals or Forecast at the current cell can appear correct by period while producing an incorrect total. The next source example demonstrates that problem. The following additive version calculates Actuals and the filtered Forecast separately. KEEPFILTERS intersects the forecast boundary with the visual’s existing date context.
Counterexample: this source expression demonstrates the incorrect total discussed above.
Sales Actuals + Forecast (Wrong Total) =
VAR LastSalesDate = CALCULATE(MAX(fctSales[DateKey]), REMOVEFILTERS('Date'[Date])) -- 30 June 2020
RETURN
IF(
    MAX('Date'[Date]) > LastSalesDate,
    [Sales Forecast],
    [Sales Actuals] )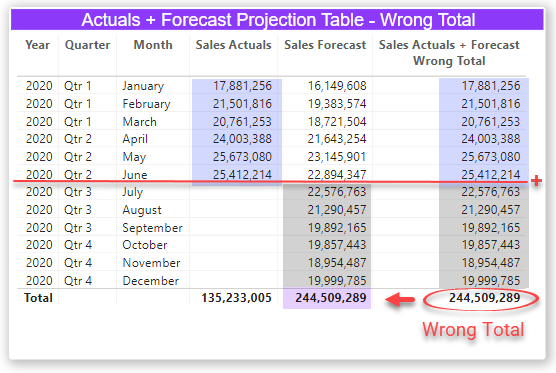
Sales Actuals + Forecast =
VAR LastSalesDate = CALCULATE(MAX(fctSales[DateKey]), ALL(fctSales) ) -- 30 June 2020
VAR Actuals = [Sales Actuals]
VAR Forecast = CALCULATE([Sales Forecast],
                        KEEPFILTERS('Date'[Date] > LastSalesDate))
RETURN
Actuals + Forecast
The full browser backup also contains three original versions of the combined measure. Compare their filter context: the first uses FILTER over VALUES, the second uses KEEPFILTERS, and the third filters the Date table. Their original expressions and comparison screenshot are restored below.
Variant 1
Sales Actuals + Forecast v1 =
VAR LastSalesDate = CALCULATE(MAX(fctSales[DateKey]), REMOVEFILTERS('Date')) -- 30 June 2020
VAR Actuals =  [Sales Actuals]
VAR Forecast = CALCULATE([Sales Forecast],
                        FILTER(
                        VALUES('Date'[Date]),
                        'Date'[Date] > LastSalesDate) )
RETURN
Actuals + Forecast
Variant 2
Sales Actuals + Forecast v2 =
VAR LastSalesDate = CALCULATE(MAX(fctSales[DateKey]), REMOVEFILTERS()) -- 30 June 2020
VAR Actuals = [Sales Actuals]
VAR Forecast = CALCULATE([Sales Forecast],
                        KEEPFILTERS('Date'[Date] > LastSalesDate))
RETURN
Actuals + Forecast
Variant 3
Sales Actuals + Forecast v3 =
VAR LastSalesDate = CALCULATE(MAX(fctSales[DateKey]), REMOVEFILTERS()) -- 30 June 2020
VAR Actuals = [Sales Actuals]
VAR Forecast = CALCULATE([Sales Forecast],
                        FILTER(
                        'Date',
                        'Date'[Date] > LastSalesDate) )
RETURN
Actuals + Forecast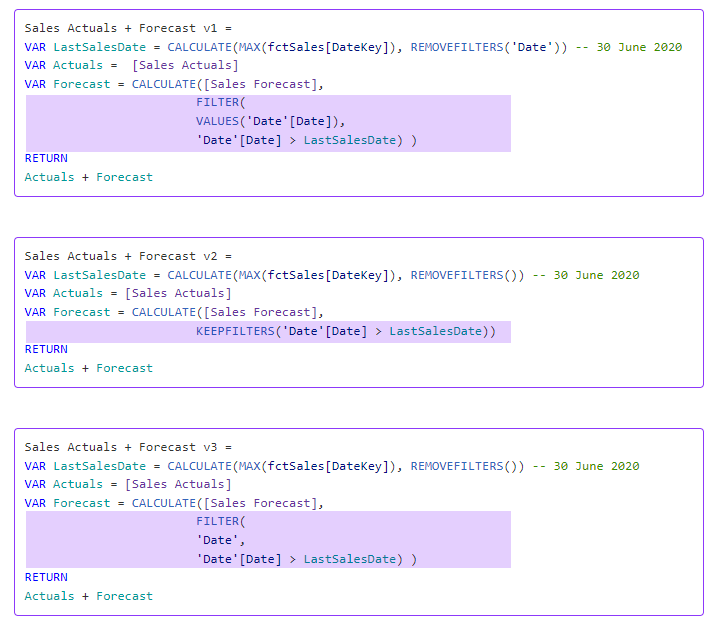
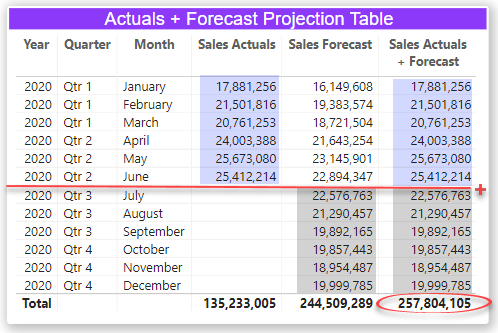
The additive expression produces the intended total in the illustrated example.
Why ALL and KEEPFILTERS matter
The original explanation credits Alberto Ferrari and SQLBI. Removing filters while calculating LastSalesDate identifies the last sales date across the intended fact-table scope, rather than only within the current visual cell. Separately, KEEPFILTERS preserves the intersection between the selected reporting period and the forecast dates. These choices define the calculation’s scope: adapt them if the last actual date should vary by product, region or another business dimension.
Forecast when the current month is incomplete
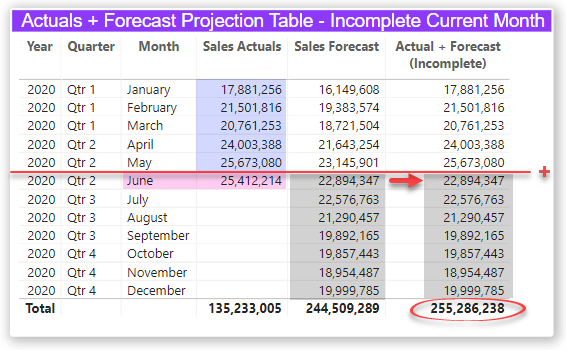
A partial month should not be presented as though it were a completed month. For example, actuals recorded by 10 June represent only part of June, so comparing that amount with the whole of June last year can be misleading. This scenario keeps the current incomplete month in the forecast portion of the projection.
Adapt table names, date columns and the Actuals and Forecast measures to your own semantic model.
Actual + Forecast (Incomplete Current) =

VAR Previous_Month_Sales = CALCULATE(EOMONTH(MAX(fctSales[DateKey]),-1), ALL(fctSales) )
//based on latest sales completed date e.g. 31 May 2020 (1 month back)
VAR Previous_Month_Current = CALCULATE(EOMONTH(TODAY(),-1), ALL('Date'))
//based on CURRENT DATE (TODAY) or May 2022

VAR Actuals = [Sales Actuals]

VAR Forecast = CALCULATE([Sales Forecast],
KEEPFILTERS('Date'[Date] > Previous_Month_Current ))

RETURN
Actuals + Forecast
The example uses historical 2020 sales data and includes two possible cutoffs: the end of the month before the latest sales date, and the end of the month before TODAY(). The retained expression uses Previous_Month_Current in the forecast filter. If you need a boundary driven by the historical sales data instead, choose Previous_Month_Sales deliberately. Check that the chosen Actuals measure does not also contribute the incomplete month when you intend to show forecast only for that month.
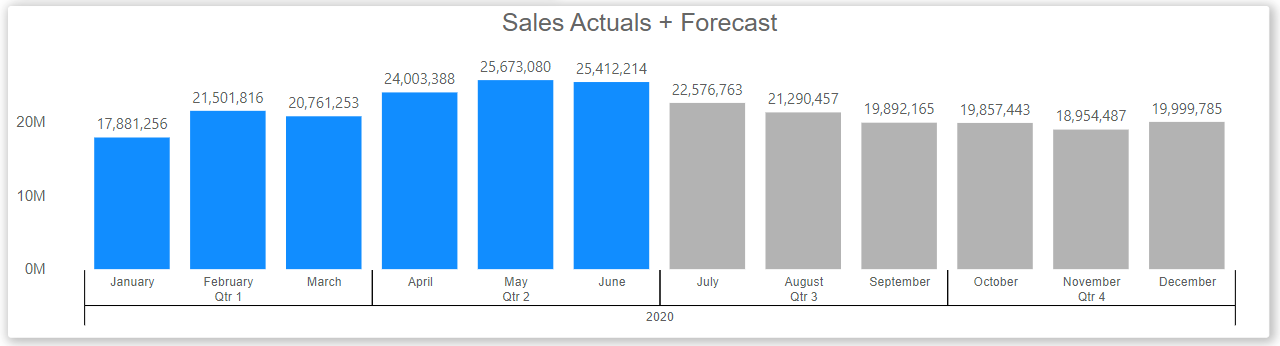
Use a separate colour measure when a bar or column chart should distinguish actual periods from forecast periods.
Sales Actuals + Forecast Color =
VAR LastSalesDate = CALCULATE(MAX(fctSales[DateKey]), ALL(fctSales) ) -- 30 June 2020
VAR Actuals =  [Sales Actuals]
VAR Forecast = CALCULATE([Sales Forecast], KEEPFILTERS('Date'[Date] > LastSalesDate))
RETURN
IF(Actuals,1,0)
Apply the colour measure in conditional formatting. In the illustrated rule, a result of 0 uses grey for forecast periods; configure the other result for actual periods.
The source illustration shows the resulting scenario colours.
Data model relationships
Relate both fact tables to the shared dimensions, including the calendar. Avoid joining the Actuals and Forecast facts directly merely to combine them in a visual.