
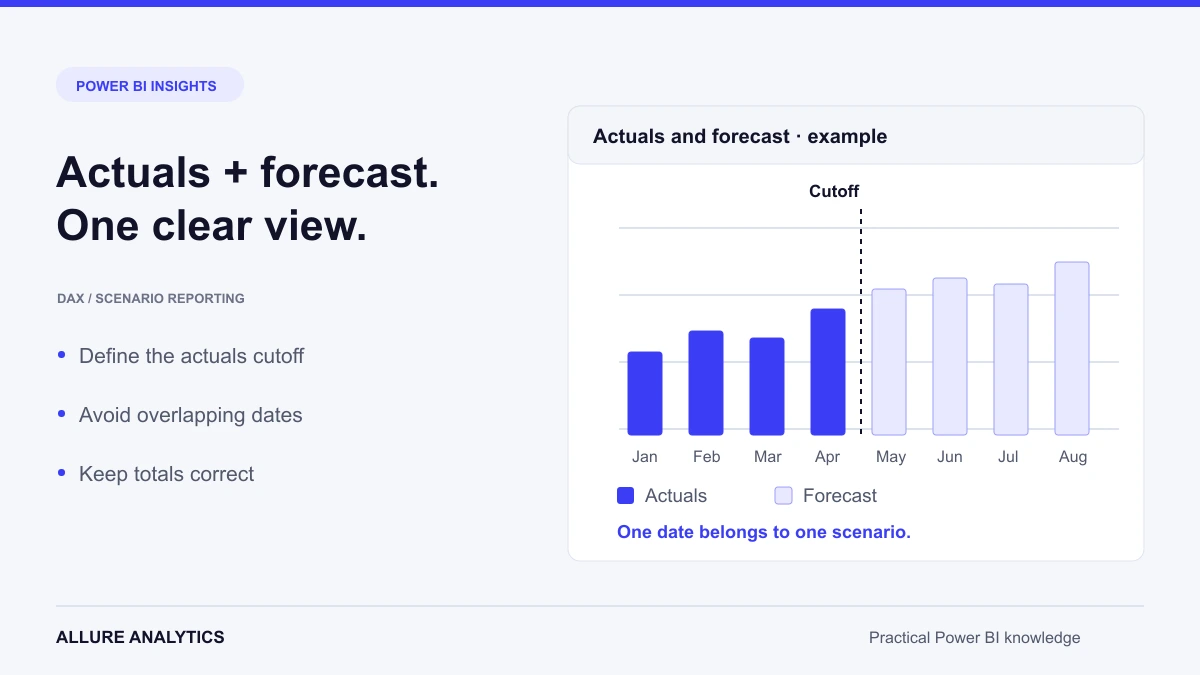
An actuals-plus-forecast measure should show what has happened up to a defined cutoff and what is expected after it. The difficult part is agreeing on that cutoff and keeping the calculation correct at every level of the report.
Give actuals and forecast a shared reporting context
Use a common Date dimension and compatible product, customer or organisational dimensions to filter both facts. Define the grain of each fact table. A monthly forecast cannot automatically be treated as daily forecast data without a deliberate allocation rule.
DAX
Sales Actuals = SUM ( Sales[SalesAmount] )

Sales Forecast = SUM ( Forecast[SalesAmount] )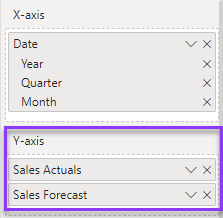
Define a business cutoff
The last loaded transaction date is not always the last completed reporting period. A closed-through date from a control table is usually clearer when finance or operations owns the reporting close. If you use the last actual date, decide whether it is global or specific to the selected entity.
The following example removes only Date-table filters while retaining product and other dimension filters. Its cutoff can therefore differ by entity. That is an intentional policy choice, not a universal default.
DAX
Actual + Forecast =
VAR CutoffDate =
    CALCULATE ( MAX ( Sales[Date] ), REMOVEFILTERS ( 'Date' ) )
VAR ActualPart =
    CALCULATE (
        [Sales Actuals],
        KEEPFILTERS ( 'Date'[Date] <= CutoffDate )
    )
VAR ForecastPart =
    CALCULATE (
        [Sales Forecast],
        KEEPFILTERS ( 'Date'[Date] > CutoffDate )
    )
RETURN
    IF ( ISBLANK ( CutoffDate ), [Sales Forecast], ActualPart + ForecastPart )
KEEPFILTERS intersects each date partition with the current reporting period. Actuals and forecast contribute only from their respective sides of the cutoff, so the same logic works for a month, a quarter and the grand total. This example assumes a compatible daily Date relationship for both facts.
Why a simple IF can produce the wrong total
DAX
IF (
    MAX ( 'Date'[Date] ) > CutoffDate,
    [Sales Forecast],
    [Sales Actuals]
)
This expression chooses one branch for the entire current context. At a total covering both actual and future dates, MAX(Date) can select forecast for the whole total. Splitting the date set into actual and forecast partitions avoids that problem for additive sales amounts. Ratios and other nonadditive measures require their own total logic.
Handle an incomplete current month without double counting
If the policy is “actuals through the last closed month, forecast afterwards”, apply the same closed-month cutoff to both parts. Adding all current-month actuals to a full-month forecast can count part of the month twice.
DAX
Actual + Forecast (Closed Months) =
VAR CutoffDate = EOMONTH ( TODAY (), -1 )
RETURN
    CALCULATE (
        [Sales Actuals],
        KEEPFILTERS ( 'Date'[Date] <= CutoffDate )
    )
    + CALCULATE (
        [Sales Forecast],
        KEEPFILTERS ( 'Date'[Date] > CutoffDate )
    )
TODAY() is only an illustrative month-close policy. Replace it with an approved closed-through date when reporting close can lag the calendar or differ between entities. For a forecast stored at month grain, evaluate complete months or implement the approved daily allocation first.
Make the transition visible
Use separate actual and forecast series, an explicit legend and a visible cutoff where the chart supports it. A solid actual line and a distinct forecast treatment help readers understand the transition. Do not rely on colour alone.
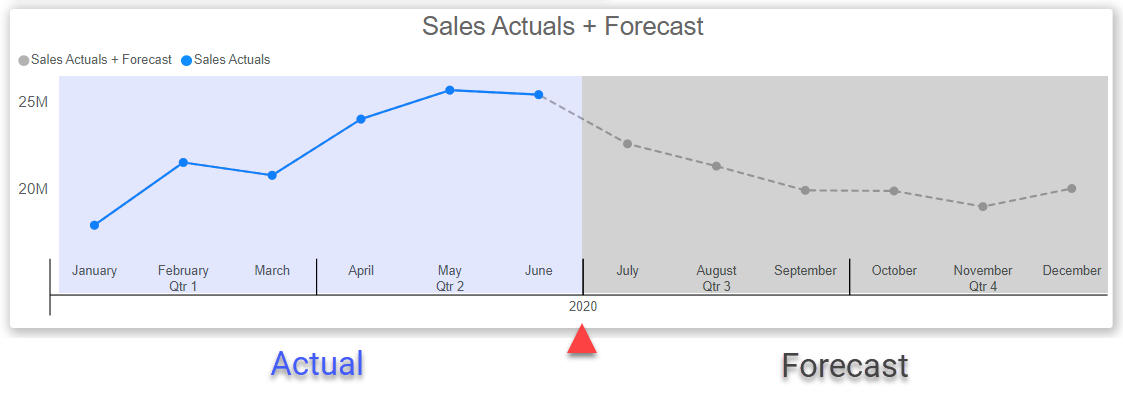
A period containing both actual and forecast dates cannot be described accurately by a single “actual” or “forecast” colour. Split the series or label the mixed period. Make the same cutoff definition available in a tooltip or report note.
Validate the result at every level
- Check a completed actual month and a future forecast month.
- Check a month that crosses the cutoff.
- Compare the quarter, year and grand total with a known expected sum.
- Test an entity with no actual data and document the intended forecast fallback.
- Check the effect of date, product and organisational slicers.
- Validate refresh timing, forecast grain and the business close date.
The objective is a defensible projection. A reader should be able to tell which dates are actual, which are forecast, and why the transition occurs where it does.
Complete DAX and Power Query reference
The following reference retains every substantive code example from the supplied article, including alternative approaches and examples that demonstrate a problem. Table names and historical date ranges are preserved. Compare these alternatives with the updated guidance above before adapting them to your model.
Sales Actuals
DAX
Sales Actuals = SUM(Sales[SalesAmount])Sales Forecast
DAX
Sales Forecast = SUM(Forecast[ForecastAmount])Sales Actuals + Forecast (Wrong Total)
Counterexample: the original IF-based selection demonstrates why a measure can produce an incorrect grand total. The corrected additive pattern is explained above.
DAX
Sales Actuals + Forecast (Wrong Total) =
VAR LastSalesDate = CALCULATE(MAX(fctSales[DateKey]), REMOVEFILTERS('Date'[Date])) -- 30 June 2020
RETURN
IF(
    MAX('Date'[Date]) > LastSalesDate,
    [Sales Forecast],
    [Sales Actuals] )
Sales Actuals + Forecast
DAX
Sales Actuals + Forecast =
VAR LastSalesDate = CALCULATE(MAX(fctSales[DateKey]), ALL(fctSales) ) -- 30 June 2020
VAR Actuals = [Sales Actuals]
VAR Forecast = CALCULATE([Sales Forecast],
                        KEEPFILTERS('Date'[Date] > LastSalesDate))
RETURN
Actuals + Forecast
Actual + Forecast (Incomplete Current)
DAX
Actual + Forecast (Incomplete Current) =
VAR Previous_Month_Sales = CALCULATE(EOMONTH(MAX(fctSales[DateKey]),-1), ALL(fctSales) )
//based on latest sales completed date e.g. 31 May 2020 (1 month back)
VAR Previous_Month_Current = CALCULATE(EOMONTH(TODAY(),-1), ALL('Date'))
//based on CURRENT DATE (TODAY) or May 2022
VAR Actuals = [Sales Actuals]
VAR Forecast = CALCULATE([Sales Forecast],
KEEPFILTERS('Date'[Date] > Previous_Month_Current ))
RETURN
Actuals + Forecast
Sales Actuals + Forecast Color
DAX
Sales Actuals + Forecast Color =
VAR LastSalesDate = CALCULATE(MAX(fctSales[DateKey]), ALL(fctSales) ) -- 30 June 2020
VAR Actuals =  [Sales Actuals]
VAR Forecast = CALCULATE([Sales Forecast], KEEPFILTERS('Date'[Date] > LastSalesDate))
RETURN
IF(Actuals,1,0)
Full source narrative and setup notes
Read every original instruction and explanation
This reference preserves the original article’s prose, setup steps and small inline expressions. Historical interface labels and recommendations are retained for comparison with the updated guidance above.
You want to show actual and forecasted future values as a connected line or in bar chart but with different conditional formatting?
Before starting it, I would suggest that you have or create a calendar date table and connect in a right way to the Actuals and Forecast tables. How to create a calendar table you will find in another article
At the end of the article will show you the right way of data model relationships.
Forecast Projection for Completed Month
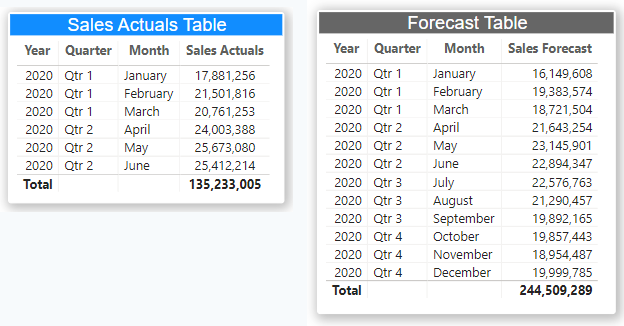
Let say that your data model has two tables: Sales Actuals and Forecast
Suppose you have created two measures: Sales Actuals and Sales Forecast.
Then drag and drop them in Y-axis.
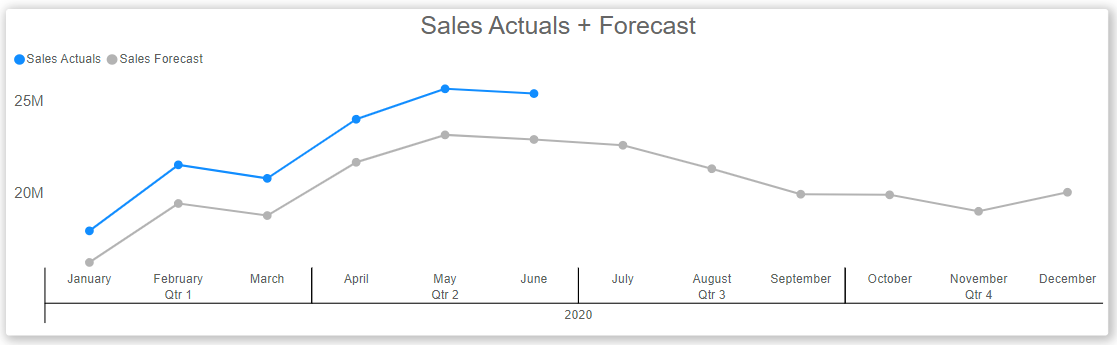
The result will be:
In order to put them into one line then you need two measures – one that returns the actual values for example Sales Actuals and the other measure that returns the actual values for dates before the last sales date and forecasted values after like Sales Actuals + Forecast.
The order of the measures is shown below. Sales Actuals is below
The trick here is that they are overlapping.
The first step is to create Sales Actuals + Forecast measure
You need to find that last sales date which you can do with a max function as this returns the last sales date in the filter context you need to remove any filter on date using calculate and remove filters while you might think of using an if function this would return the wrong values if you want to show totals.
I will show the version based on modifying the filter context in forecast variable and one showing wrong total.
The second alternative is to simply write your filter condition but wrap it in a KEEPFILTERS function so that it doesn’t override the filter from the visual place the measure on a line chart and add the actuals measure below it on values
Here is the result with Correct Total:
Important Note!
Dynamic Forecast Projection for Incomplete Current Month Sales
This is dynamic transition from Actuals to Forecast based on current month. If the current month is not complete (e.g. now is 10th of June) we will show forecast for June
As you may notice, the example in this article I am using historical data (2020) but you data may be updated daily and using functions like TODAY() is what you need.
In that case change the variable from Previous_Month_Sales to Previous_Month_Current
If you prefer to show in bar chart, you may create conditional format measure to change the color from Actuals to Forecast
Then use this measure as a Rule (=0 gray) in conditional formatting of the bar chart
The result will look like:
Data Model
Here is the right way of table relationship of the data model